Across the daily, 4 hour and 1 hour timeframes, 1000SATS USDT faces resistance between 0.0006602 – 0.0005212. Downside pressure will increase on any retests of supply zones or the bearish FVGs.
Support exists at the current price level. Traders may look for shorting opportunities on rallies or resistance breaks of the key levels.
Daily Timeframe
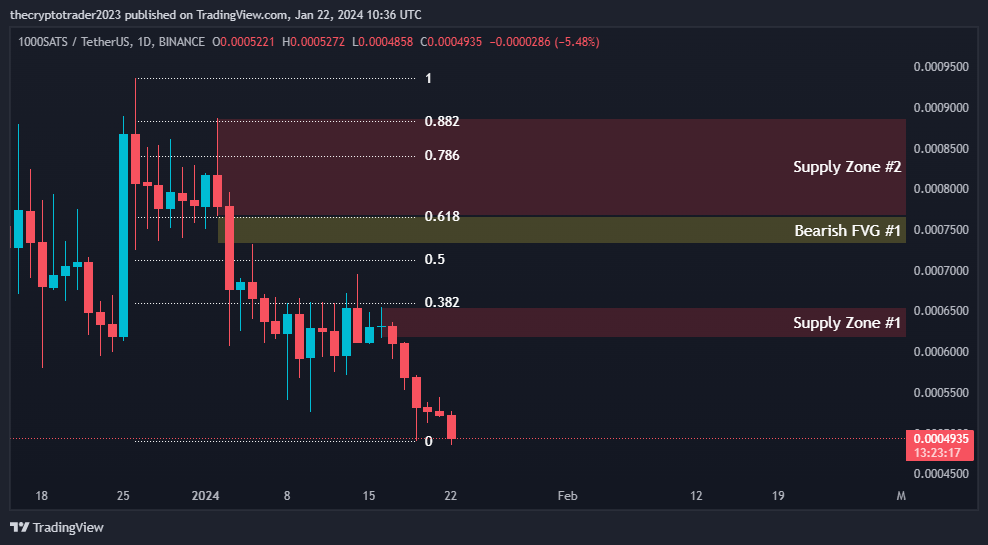
On the daily timeframe the price faces strong resistance between 0.0006602 – 0.0008402 based on Fibonacci levels and supply zones. Downside pressure will increase if testing the bearish FVG. Immediate support exists at the current price level.
Daily Timeframe Analysis On the daily chart, the current price of Sats is trading at 0.0004903. Let us analyze the key support and resistance levels based on the Fibonacci retracement and zone data provided:
Fibonacci Retracement Levels
- The 0.382 retracement level is at 0.0006602 which acts as strong resistance.
- The 0.50 level is at 0.0007126.
- The 0.618 level is at 0.0007649 which also provides resistance.
- The 0.786 level is the strongest resistance level in this range at 0.0008402.
Supply Zones
- Supply zone #1 between 0.0006550 and 0.0006167 was previously tested but holds as resistance.
- Supply zone #2 between 0.0008873 and 0.0007671 overrides all resistance levels and will act as a ceiling if reached.
Fair Value Gap
- The bearish FVG between 0.0007671 and 0.0007317 adds downward pressure if testing the upper boundary from below.
Fibonacci Retracement Levels
| 0.382 | 0.0006602 |
| 0.50 | 0.0007126 |
| 0.618 | 0.0007649 |
| 0.786 | 0.0008402 |
| 0.882 | 0.0008827 |
Supply Zone
| Zone Number | High | Low |
| Supply Zone #1 | 0.0006550 | 0.0006167 |
| Supply Zone #2 | 0.0008873 | 0.0007671 |
Fair Value Gaps / Imbalances
| Gap Number | High | Low |
| Bearish FVG #1 | 0.0007671 | 0.0007317 |
4 Hour Timeframe
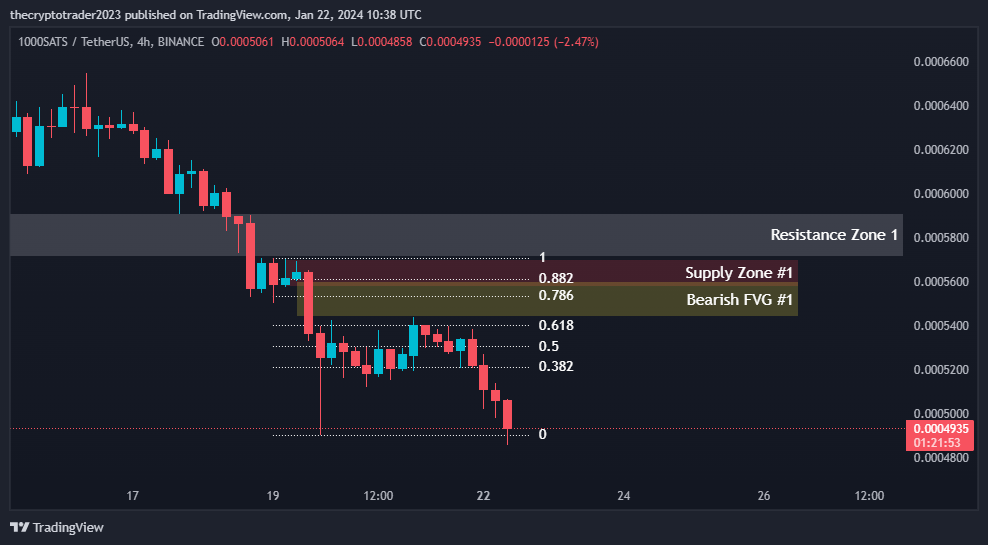
On the 4 hour timeframe the price is facing resistance between 0.0005913 – 0.0005399 based on Fibonacci levels and supply zones. Downside pressure will increase if the bearish FVG is retested. Support exists at the current price level.
Support and Resistance
- Resistance level #1 between 0.0005913 and 0.0005712 was previously tested but holds for now.
Fibonacci Retracement Levels
- The 0.382, 0.50, 0.618 levels provide resistance between 0.0005212 – 0.0005399.
- The 0.786 level at 0.0005535.
Supply Zone
- Supply zone #1 between 0.0005704 and 0.0005575 acts as strong resistance.
Fair Value Gap
- The bearish FVG between 0.0005600 and 0.0005437 adds downside pressure if retested from below.
Support and Resistance Levels
| S / R Type | High | Low |
| Resistance Level #1 | 0.0005913 | 0.0005712 |
Fibonacci Retracement Levels
| 0.382 | 0.0005212 |
| 0.50 | 0.0005303 |
| 0.618 | 0.0005399 |
| 0.786 | 0.0005535 |
| 0.882 | 0.0005610 |
Supply Zone
| Zone Number | High | Low |
| Supply Zone #1 | 0.0005704 | 0.0005575 |
Fair Value Gaps / Imbalances
| Gap Number | High | Low |
| Bearish FVG #1 | 0.0005600 | 0.0005437 |
1 Hour Timeframe
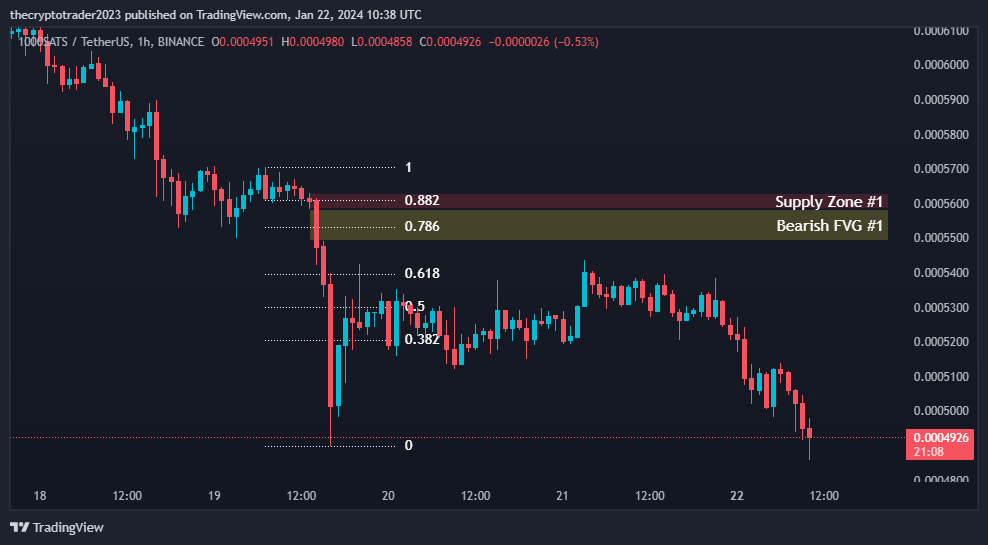
On the 1 hour timeframe the price faces resistance between 0.0005631 – 0.0005206 based on the identified levels. Downside pressure exists from the bearish FVG. Support is at the current price.
Fibonacci Retracement Levels
- Providing resistance between 0.0005206 – 0.0005397.
- The 0.786 level also at 0.0005532.
Supply Zone
- Supply zone #1 between 0.0005631 and 0.0005583 holds the upper range in resistance.
Fair Value Gap
- The bearish FVG between 0.0005583 and 0.0005490 adds downside pressure if retested.
Fibonacci Retracement Levels
| 0.382 | 0.0005206 |
| 0.50 | 0.0005301 |
| 0.618 | 0.0005397 |
| 0.786 | 0.0005532 |
| 0.882 | 0.0005609 |
Supply Zone
| Zone Number | High | Low |
| Supply Zone #1 | 0.0005631 | 0.0005583 |
Fair Value Gaps / Imbalances
| Gap Number | High | Low |
| Bearish FVG #1 | 0.0005583 | 0.0005490 |