The current price of SOL USDT is $104.17. Overall, the short term trend has been downwards over the past month after hitting a high of $118.78 in mid-January. However, there are signs the selling pressure may be easing with recent consolidation forming above key support levels.
In this technical analysis of SOL USDT, I will analyze the support and resistance levels, Fibonacci retracements, demand zones, moving averages, and volume profile to gauge the likely next move and provide trade levels.
A break above $108.83 on increasing volume could signal buyers are regaining control and open the path towards $116. Above $116, the recent high at $118.78 would be targeted. This would flip the near-term bias bullish above current resistance.
Alternatively, failure to hold above $102.67 on a daily close could see the bears increase selling pressure with $97-92 the next key support region. A breakdown below here, particularly on high volume, would shift the bias bearish again in the short-run.
Given the uncertain technical backdrop, traders may consider patiently waiting for a follow through day with volume before entering positions. Tight stops would also be advised to protect profits if the range holds.
Overall, the analysis shows how confluent demand and supply alongside Fibonacci retracements can highlight future potential areas of interest. This will help inform my SOL USDT trading decisions in the days ahead.
SOL USDT Technical Analysis
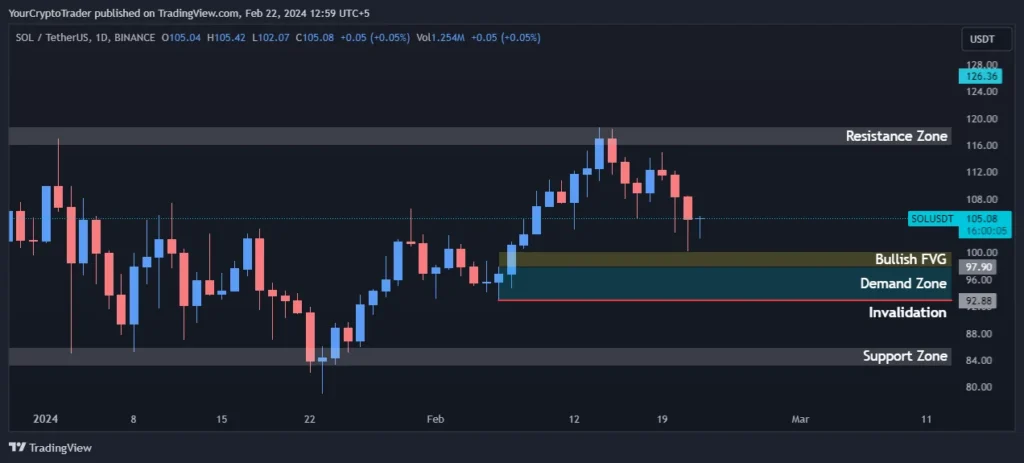
There are two key support zones on the downside. The lower support zone sits between $83.21–$85.97. Breaking below here could open the door to further weakness. However, the stronger support lies between $92.88-97.88 which encompasses the point of control on the volume profile. Holding above this area would be encouraging for bulls.
On the upside, resistance is initially seen between $116.02–$118.78. Breaking above here could spark a retest of the January high. Stronger resistance is seen at around $126.49 which marks the 161.8% Fibonacci extension level. For the short-term trend to flip bullish, one of these resistance levels needs to give way to new higher highs.
Support Levels
| Support Zone Number | Price High | Price Low |
| Support Zone | 85.97 | 83.21 |
Resistance Levels
| Resistance Zone Number | Price High | Price Low |
| Resistance Zone | 118.78 | 116.02 |
Fibonacci Retracement Levels
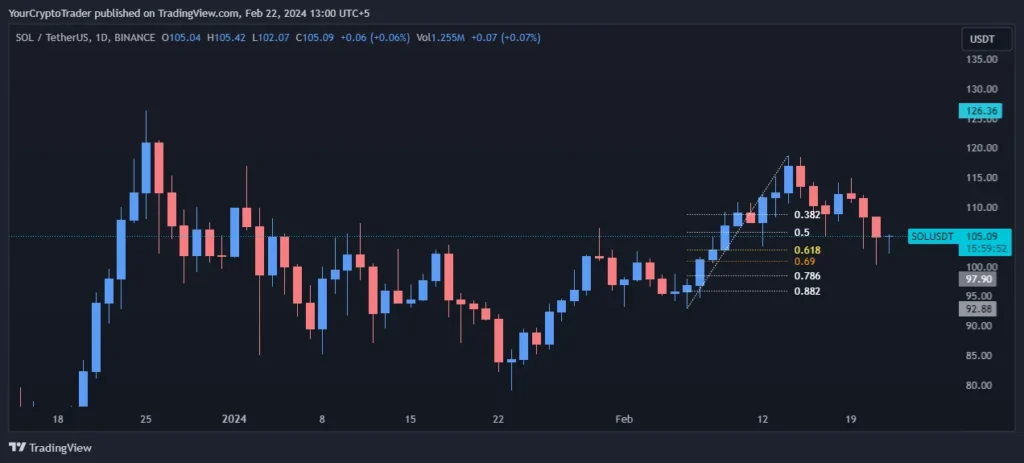
Fibonacci retracement levels provide traders with defined price objectives for pullbacks and can highlight areas of interest. The recent high to low move has retraced to the 0.382 Fibonacci level at $108.83 which has held as resistance for now.
A daily close above here would be a positive development. Below that, support lies at the 0.5 and 0.618 retracement levels of $105.81 and $102.67 respectively. A breakdown below $102.67 could open the path to test the 0.786 and 0.882 levels. These retracements will be important to watch over the coming sessions.
| Fib Retracement Value | Price |
| 0.382 Fib Level | 108.83 |
| 0.500 Fib Level | 105.81 |
| 0.618 Fib Level | 102.67 |
| 0.786 Fib Level | 98.44 |
| 0.882 Fib Level | 95.96 |
Demand Zones
There is a demand zone identified between $92.88–$97.88 which encapsulates the point of control on the volume profile. Considering this lines up with the support level outlined earlier, it is clearly an important cluster. Bulls will want to see this area hold to maintain an upward bias. A daily close below $92.88 could shift momentum in favor of further downside.
| Demand Zone Number | Price High | Price Low |
| Demand Zone | 97.88 | 92.88 |
Fair Value Gaps / Imbalances (FVG)
| FVG Zone Number | Price High | Price Low |
| Bullish FVG | 100.23 | 97.88 |
Exponential Moving Averages (EMA) Levels
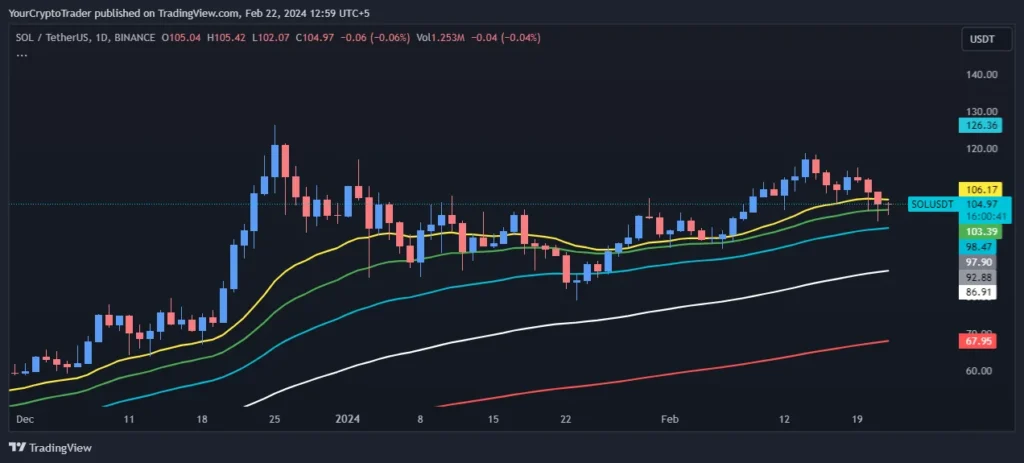
Exponential Moving Averages (EMA) The shorter term EMAs are currently Bearishly aligned with the 21 EMA and 34 EMA below the 55 EMA. However, prices have held above them the past few sessions. A daily close back above the 55 EMA at $98.45 would be the first sign of a potential trend change.
Longer term, the 100 EMA at $86.91 and 200 EMA at $67.95 will be significant to watch for bulls as reclaiming these would confirm an uptrend is underway.
| EMA Type | EMA Price on Chart |
| 200 EMA (Red Color) | 67.95 |
| 100 EMA (White Color) | 86.91 |
| 55 EMA (Blue Color) | 98.45 |
| 34 EMA (Green Color) | 103.36 |
| 21 EMA (Yellow Color) | 106.13 |
Fixed Range Volume Profile Levels
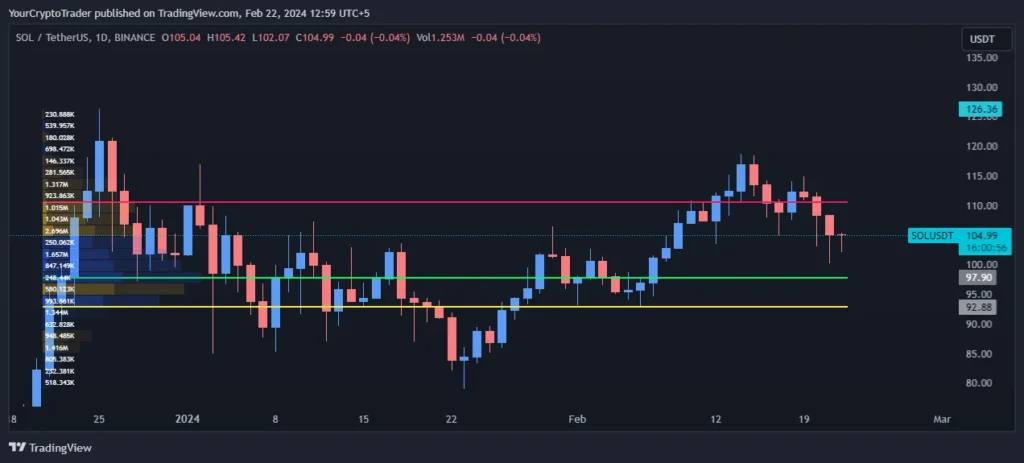
Volume Profile The volume profile reveals a significant point of control (POC) at $97.72 which aligns with the key demand zone. The value area high (VAH) is at $110.87 which intersects with resistance. Meanwhile, the value area low (VAL) is pegged at $92.88 which forms the lower boundary of demand.
This technical confluence between volume profile and demand/supply zones gives these levels greater weight.
| Point of Control (POC) | Value Area High (VAH) | Value Area Low (VAL) |
| 97.72 | 110.87 | 92.88 |
Trade Bias
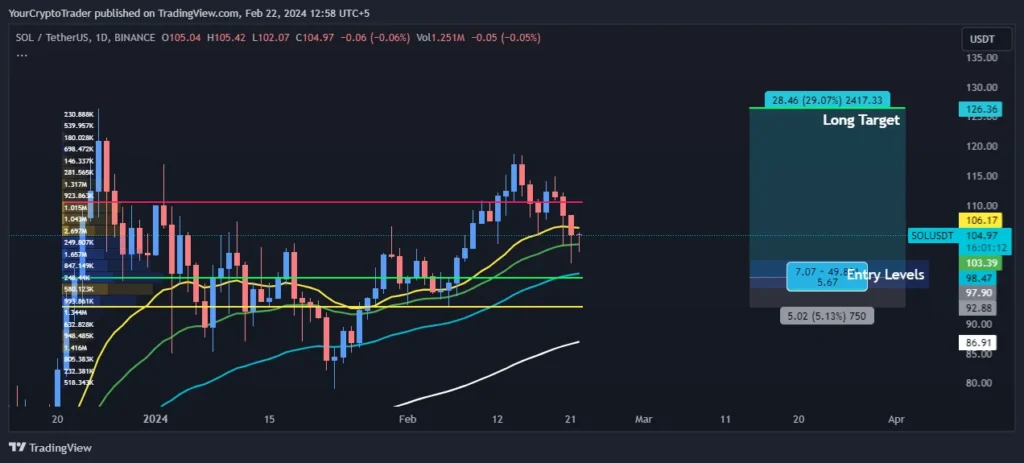
Trade Bias: Long
Entry Levels
| Entry Level Zone Number | Entry Level Price |
| Entry Levels 1 | 100.80 |
| Entry Levels 2 | 95.97 |
Invalidation Levels
| Invalidation Type (Long, Short) | Invalidation Price |
| Long | 92.88 |
Target Levels
| Target Level | Target Price |
| Long Target | 126.49 |
Disclaimer: This analysis is for informational purposes only and should not be considered financial advice. Please do your own research before making any trading decisions.