The current price of Ethereum on the USDT pair is trading at 2897.32. Let’s do a comprehensive technical analysis of ETH USDT to identify potential support, resistance, and trading opportunities.
The confluence from multiple timeframes points to continued upside momentum for ETH USDT from current levels. Pullbacks into the demand zone and Fib retracements provide lower risk buying opportunities.
Traders can look to place stops just below solid support and scale out of long positions on strength above 2900 towards the multi-week target. Maintaining above the long-term 200 EMA keeps the bull thesis intact.
ETH USDT Technical Analysis
Support Levels
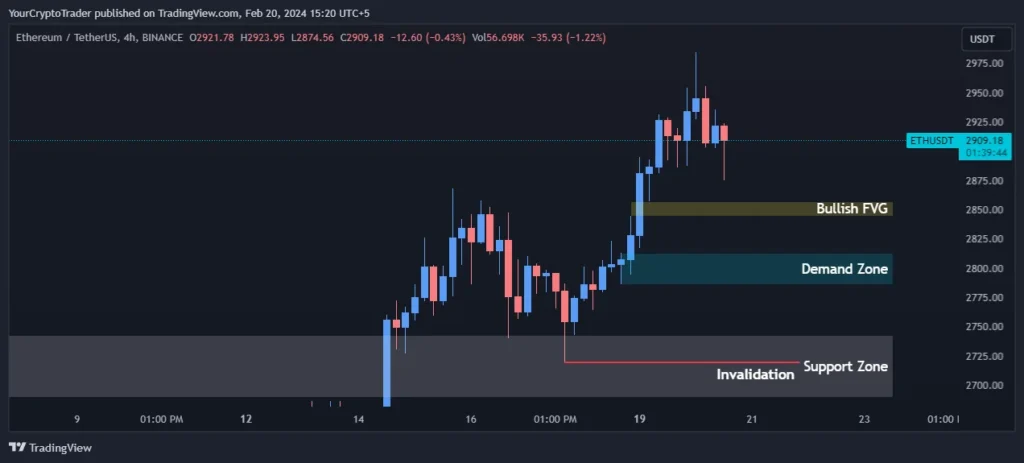
ETH USDT has strong support in the 2689.39-2742.73 zone. This key support zone should hold on any price pullbacks. A break below this level could see further downward movement towards weaker support at around 2600. Based on the price action over the past month, this support zone has held firm on multiple retests, indicating buying demand at these levels.
| Support Zone Number | Price High | Price Low |
| Support Zone | 2689.39 | 2742.73 |
Fibonacci Retracement Levels
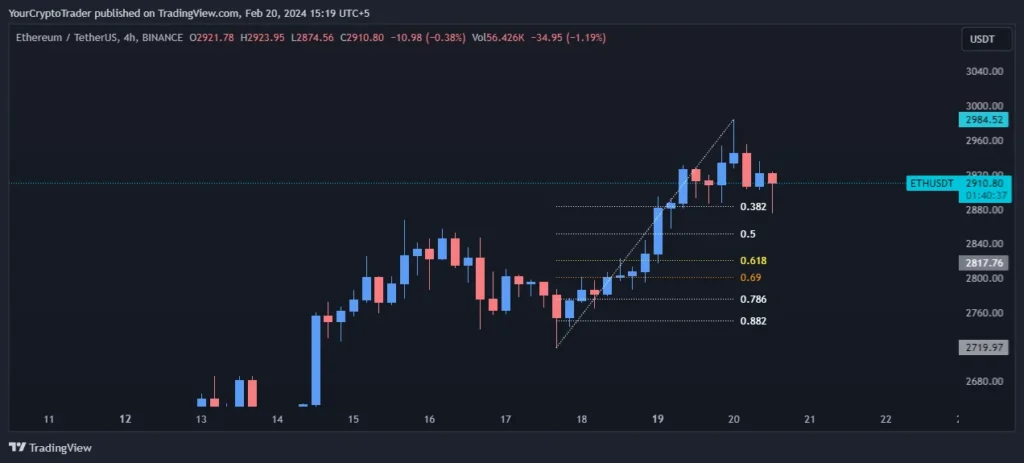
Fibonacci retracement levels show potential reversal areas if the price pulls back. The 0.382, 0.500, and 0.618 Fib levels fall between 2883.65-2820.88. These retracement levels correspond very closely with the demand zone and fair value gap areas, adding confluence to their significance. A bounce off any of these retracement levels would indicate the broader uptrend remains intact.
| Fib Retracement Value | Price |
| 0.382 Fib Level | 2883.65 |
| 0.500 Fib Level | 2851.43 |
| 0.618 Fib Level | 2820.88 |
| 0.786 Fib Level | 2776.36 |
| 0.882 Fib Level | 2750.18 |
Demand Zones
The demand zone between 2813.20-2785.89 is where long-term holders are most likely to accumulate on dips. This zone perfectly corresponds with the 0.382-0.500 Fib retracement levels and stands out as a significant support cluster. A successful retest that bounces from this area would reinforce it as an important base of support.
| Demand Zone Number | Price High | Price Low |
| Demand Zone | 2813.20 | 2785.89 |
Fair Value Gaps / Imbalances (FVG)
The bullish gap between 2856.93-2844.50 shows an area where buyers are eager to enter on corrections. Gaps tend to get filled over time, so this represents a magnet area attracting price back within its boundaries. A move higher from the lower end of this gap would add buy-side confirmation.
| FVG Zone Number | Price High | Price Low |
| Bullish FVG | 2856.93 | 2844.50 |
Exponential Moving Averages (EMA) Levels
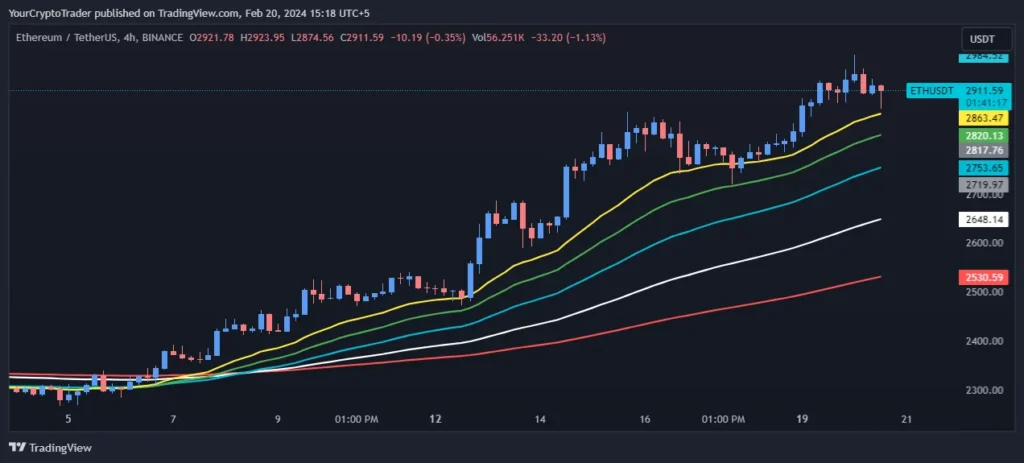
The shorter EMAs are in a golden cross formation with the 55 above the 34, indicating upward momentum is likely to continue in the medium-term. The 200 EMA at 2530.53 provides the ultimate benchmark of support for the long-term trend to remain bullish. As long as ETHUSDT holds above this level on pullbacks, the path of least resistance is up.
| EMA Type | EMA Price on Chart |
| 200 EMA (Red Color) | 2530.53 |
| 100 EMA (White Color) | 2648.01 |
| 55 EMA (Blue Color) | 2753.54 |
| 34 EMA (Green Color) | 2819.35 |
| 21 EMA (Yellow Color) | 2863.47 |
Fixed Range Volume Profile Levels
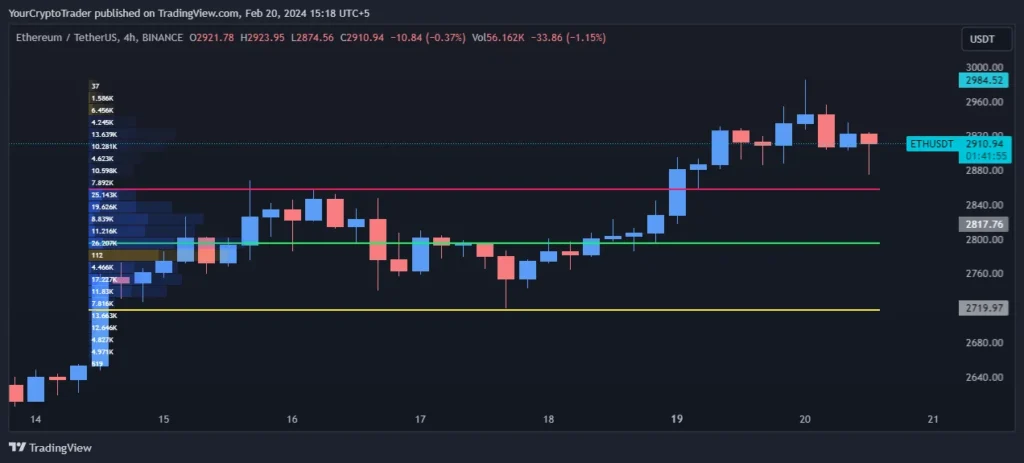
The Point of Control at 2794.34 indicates this is the “fair” price where most of the volume trading activity has occurred. Strength above this level shows buyers are actively driving the market higher. The Value Area High at 2859.18 could act as immediate resistance if tested.
| Point of Control (POC) | Value Area High (VAH) | Value Area Low (VAL) |
| 2794.34 | 2859.18 | 2717.58 |
Trade Bias
Based on the confluence of bullish factors like holding support, bullish gaps and moving averages, the analysis favors maintaining a long bias with the expectation of further upside potential towards the long-term target.
Trade Bias: Long
Entry Levels
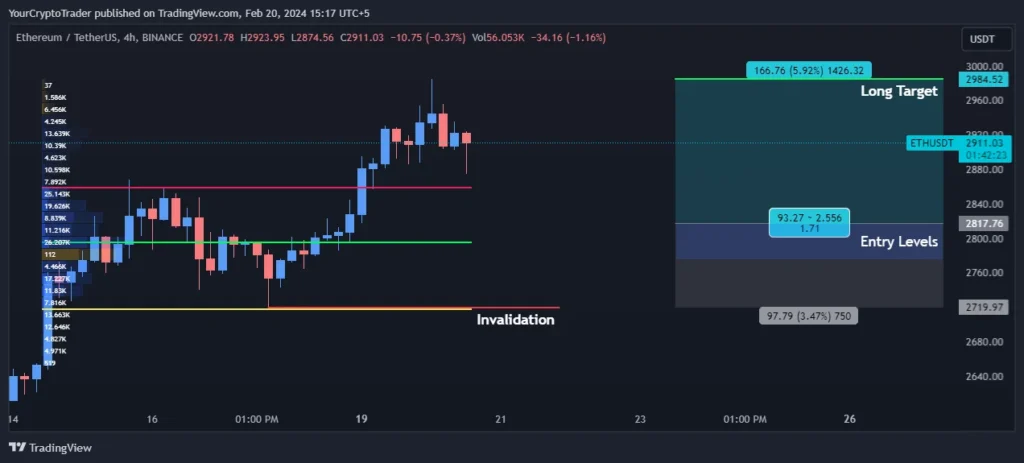
Traders can look to enter long positions on minor dips towards the first entry level of 2817.76. Tighter stops below the second entry level of 2775.31 prudently manages risk.
| Entry Level Zone Number | Entry Level Price |
| Entry Levels 1 | 2817.76 |
| Entry Levels 2 | 2775.31 |
Invalidation Levels
A break below the key support level of 2719.01 would invalidate the bullish thesis and likely see another leg lower towards stronger support in the 2600-2650 zone. This provides optionality to exit long positions aggressively on an invalidating move.
| Invalidation Type (Long, Short) | Invalidation Price |
| Long | 2719.01 |
Target Levels
Upside potential looks bright, with the first long target projected all the way up at 2984.52. This target is derived from the log scale resistance level established by previous highs and swings. Profit taking along the way is advisable to lock-in gains, but scaling out above 2900 remains a compelling risk/reward proposition.
| Target Level | Target Price |
| Long Target | 2984.52 |
Disclaimer: This analysis is for informational purposes only and should not be considered financial advice. Please do your own research before making any trading decisions.