Ethereum ETH USDT has seen some volatility over the past month, finding support and resistance at key technical levels. Let’s take a closer look at the chart and indicators to gain insight into the near to medium term price outlook.
Ethereum ETH USDT shows staying power above 2600 opens the path to retest recent highs. Pullbacks to demand zones and EMA support should attract dip buyers maintaining overall upside momentum in this leading altcoin. Monitoring oscillations on the daily timeframe will be key to grasp any short term trend changes. The bull market remains intact while key support holds ground.
ETH USDT Technical Analysis
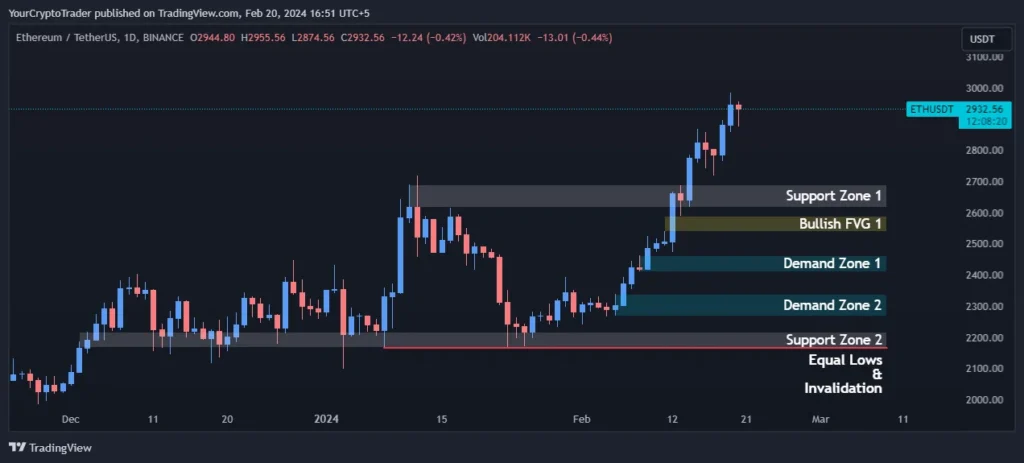
Support Levels
The chart shows us that ETH USDT has found support at two distinct zones in recent trading. The first support zone is between 2618.01-2689.39, which coincides with the bullish fair value gap zone between 2590-2539.63. Holding above this level bodes well for the bulls. Breaking below opens the door for a retest of the next support level.
The second major support zone sits lower between 2218.64-2168.07. This level lies just above the 0.500 Fibonacci retracement level of 2574.63 and the 55 EMA at 2462.75. A breakdown below here could see price pullback further to retest demand zones and the 200 EMA around 2100.
| Support Zone Number | Price High | Price Low |
| Support Zone 1 | 2618.01 | 2689.39 |
| Support Zone 2 | 2218.64 | 2168.07 |
Fibonacci Retracement Levels
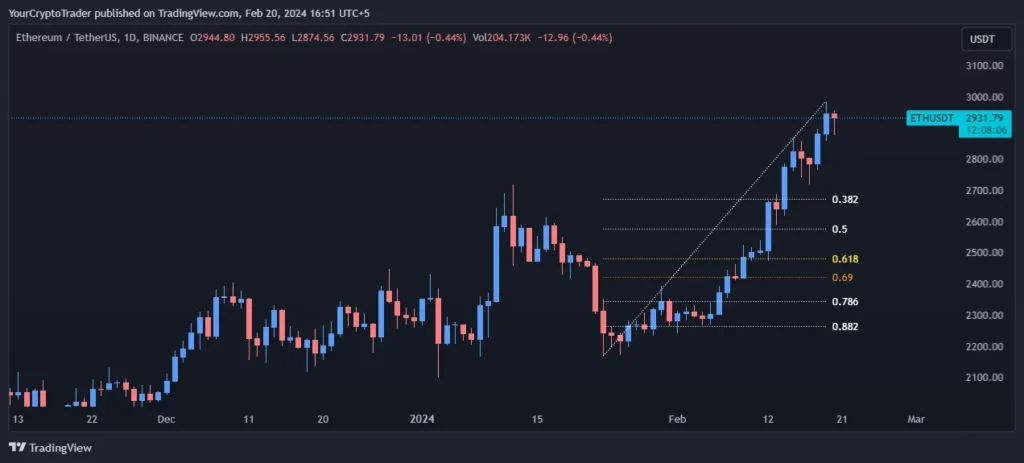
Fib Retracement levels provide technical traders with defined price objectives for pullbacks in the direction of the previous trend. On the ETH USDT chart, we can see price found support precisely at the 0.382 Fib level of 2673.60 during the latest dip. Remaining above this level bodes well for the continuation of the primary uptrend. Deeper pullbacks of 2300-2400 would target the 0.500 and 0.618 Fib levels respectively.
| Fib Retracement Value | Price |
| 0.382 Fib Level | 2673.60 |
| 0.500 Fib Level | 2574.63 |
| 0.618 Fib Level | 2484.00 |
| 0.786 Fib Level | 2341.08 |
| 0.882 Fib Level | 2265.23 |
Demand Zones
Demand zones refer to areas where buying interest is strong due to an accumulation of orders. On the ETH USDT chart, we see demand zones defined between 2463.15- 2411.01 and 2338.41-2269.11 which align with key Fib levels. A break below the lower zone at 2269.11 could pave the way for more downside.
| Demand Zone Number | Price High | Price Low |
| Demand Zone 1 | 2463.15 | 2411.01 |
| Demand Zone 2 | 2338.41 | 2269.11 |
Fair Value Gaps / Imbalances (FVG)
Fair value gaps (FVG) occur when prices gaps up or down between normal trading sessions leaving pockets in the chart with no trading activity. These zones often act as magnets, with prices unwilling to remain detached for long. On the ETH USDT chart, we see a bullish FVG between 2590-2539.63 where buyers are active on any dips into this range
| FVG Zone Number | Price High | Price Low |
| Bullish FVG 1 | 2590.00 | 2539.63 |
Exponential Moving Averages (EMA) Levels
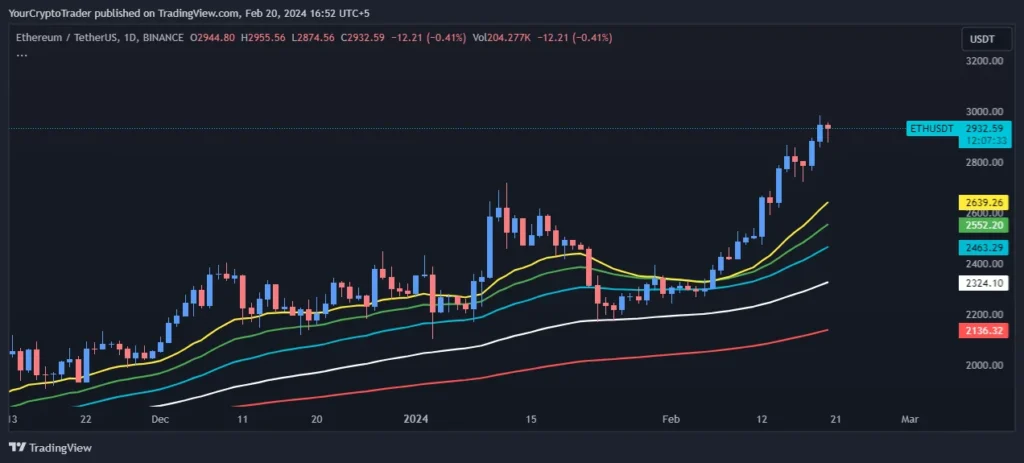
EMA ribbons provide traders with dynamic support and resistance levels. On the ETH USDT chart, the 21 EMA at 2637.90 and 55 EMA at 2462.75 have both acted as solid floors during pullbacks in the past month. A daily close below the 55 EMA would weaken the short term bullish structure. Meanwhile, a break above the 21 EMA targets retests of 2900-3000.
| EMA Type | EMA Price on Chart |
| 200 EMA (Red Color) | 2136.17 |
| 100 EMA (White Color) | 2323.80 |
| 55 EMA (Blue Color) | 2462.75 |
| 34 EMA (Green Color) | 2551.33 |
| 21 EMA (Yellow Color) | 2637.90 |
Liquidity Levels
Liquidity refers to areas where significant order flow may exist due to order book concentrations. On the ETH USDT chart, we see evident equal lows formed at 2166.38 in mid-January potentially leading to future support in line with demand zones if retested.
| Liquidity Type (Double Top, Double Bottom, Equal Lows, Equal Highs) | Price |
| Equal Lows | 2166.38 |
Fixed Range Volume Profile Levels
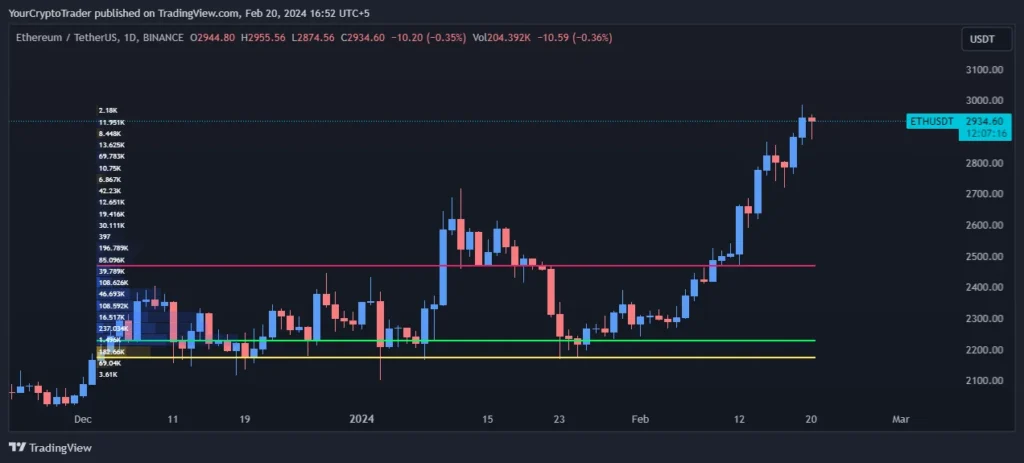
The volume profile shows the point of control (POC) at 2230.22, with the value area high (VAH) at 2469.51 and value area low (VAL) at 2175.26. These layers of liquidity could influence price action.
| Point of Control (POC) | Value Area High (VAH) | Value Area Low (VAL) |
| 2230.22 | 2469.51 | 2175.26 |
Disclaimer: This analysis is for informational purposes only and should not be considered financial advice. Please do your own research before making any trading decisions.