The current price of BTC USDT is 51107.59. The overall trade bias is long based on the technical indicators.
The technical indicators suggest the current rally could extend further with upside potential towards 52984.23 initially, as long as price remains above key support levels. The long bias remains intact as long as BTC USDT trades above 50094.45 Fib support.
BTC USDT Technical Analysis
Support Levels
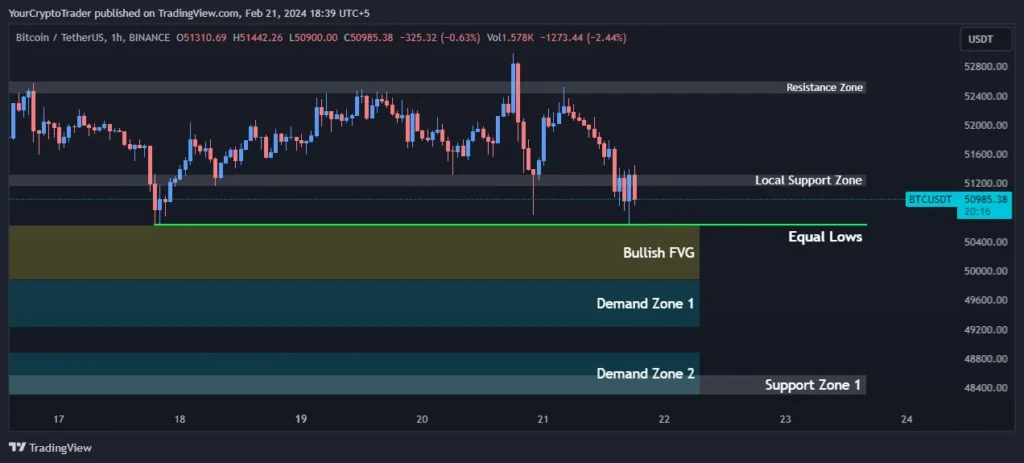
There are three key support zones between 48574.65-44293.48. Strong support lies at Support Zone 1 (48574.65-48299.89). A break below Support Zone 3 at 44600 could indicate further downside.
| Support Zone Number | Price High | Price Low |
| Support Zone 1 | 48574.65 | 48299.89 |
| Support Zone 2 | 47248.99 | 46974.23 |
| Support Zone 3 | 44600.00 | 44293.48 |
Resistance Levels
Significant resistance is seen at the Resistance Zone between 52428.70-52607.50. A break above this level could trigger further upside.
| Resistance Zone Number | Price High | Price Low |
| Resistance Zone | 52428.70 | 52607.50 |
Local Levels
Immediate support lies at the Local Support Zone between 51327.27-51155.33.
| Local Support Zone Number | Price High | Price Low |
| Local Support Zone | 51327.27 | 51155.33 |
Fibonacci Retracement Levels
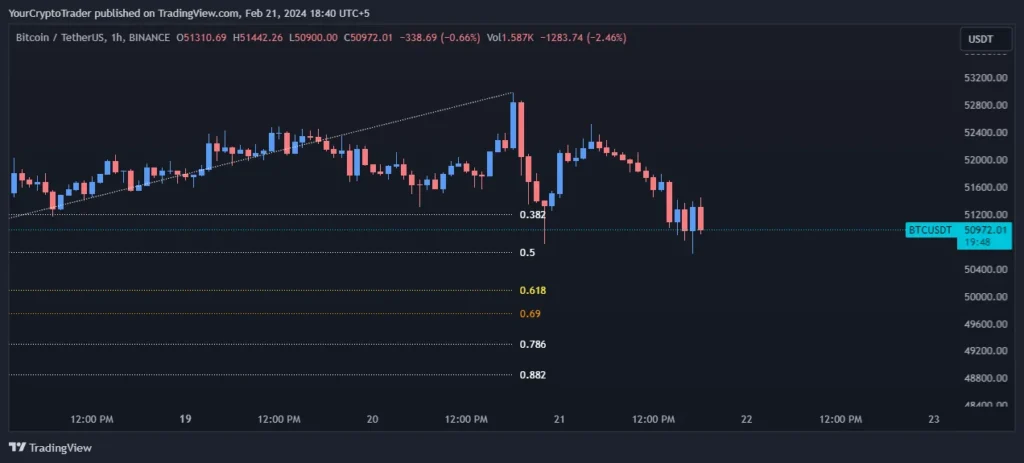
The 0.382 Fib Level at 51199.95 and 0.50 Fib Level at 50641.25 provide support. A bounce from these levels favors the long bias. The 0.618 Fib Level at 50094.45 is a key level to watch.
| Fib Retracement Value | Price |
| 0.382 Fib Level | 51199.95 |
| 0.50 Fib Level | 50641.25 |
| 0.618 Fib Level | 50094.45 |
| 0.786 Fib Level | 49298.35 |
| 0.882 Fib Level | 48860.65 |
Demand Zones
Demand Zone 1 between 49877.22-49225.01 and Demand Zone 2 between 48888.88-48300.95 could attract buying interest on dips.
| Demand Zone Number | Price High | Price Low |
| Demand Zone 1 | 49877.22 | 49225.01 |
| Demand Zone 2 | 48888.88 | 48300.95 |
Fair Value Gaps / Imbalances (FVG)
The bullish Fair Value Gap between 49877.22-50626.53 signals upside potential if price trades higher.
| FVG Zone Number | Price High | Price Low |
| Bullish FVG | 49877.22 | 50626.53 |
BTCUSDT Exponential Moving Averages (EMA) Levels
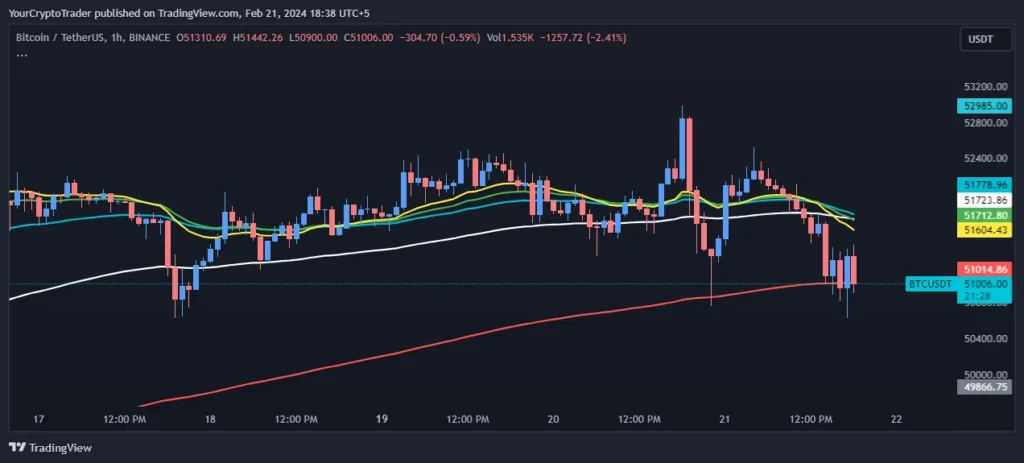
The EMAs are in an upward sloping formation validating the long term bullish trend. Price is trading above all the EMA levels reinforcing the bullish bias.
| EMA Type | EMA Price on Chart |
| 200 EMA (Red Color) | 51016.52 |
| 100 EMA (White Color) | 51726.35 |
| 55 EMA (Blue Color) | 51783.65 |
| 34 EMA (Green Color) | 51718.65 |
| 21 EMA (Yellow Color) | 51614.12 |
Liquidity Levels
| Liquidity Type (Double Top, Double Bottom, Equal Lows, Equal Highs) | Price |
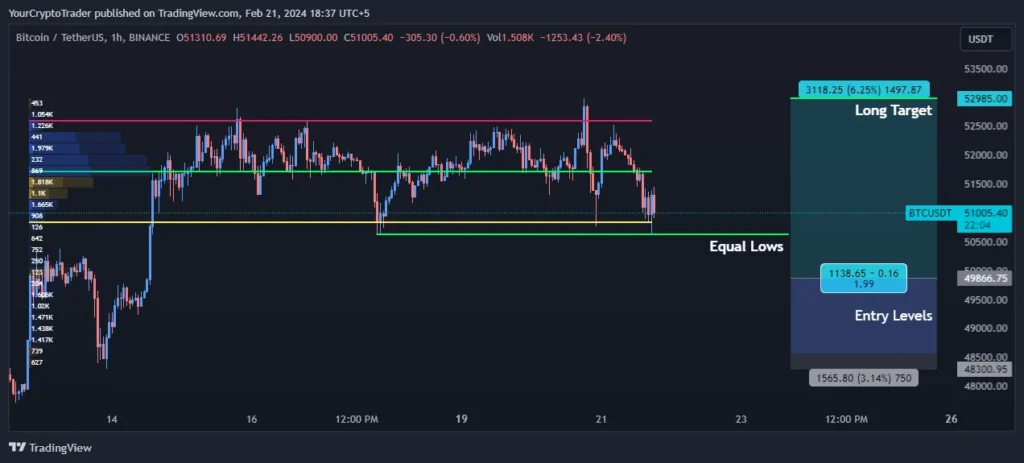
| Equal Lows | 50625.00 |
Fixed Range Volume Profile Levels
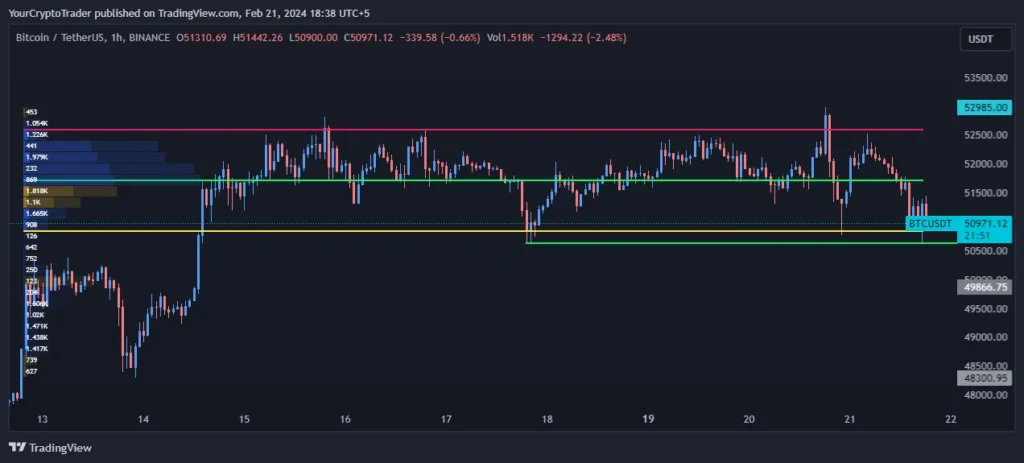
Heavy volume is clustered between 51715.20-50845.35 as per the Value Area. A close above the Point of Control (POC) at 51715.20 favors upside.
| Point of Control (POC) | Value Area High (VAH) | Value Area Low (VAL) |
| 51715.20 | 52598.25 | 50845.35 |
Trade Bias
Trade Bias: Long
Entry Levels
Entry Levels 1 at 49874.43 and Entry Levels 2 at 48561.40 provides low-risk long entry opportunities.
| Entry Level Zone Number | Entry Level Price |
| Entry Levels 1 | 49874.43 |
| Entry Levels 2 | 48561.40 |
Target Levels
An initial target is seen at the Short Target of 52984.23. A break above the Resistance Zone targets higher levels.
| Target Level | Target Price |
| Short Target | 52984.23 |
Disclaimer: This analysis is for informational purposes only and should not be considered financial advice. Please do your own research before making any trading decisions.