The current price of Ethereum (ETH) against the US Dollar Tether (USDT) trading pair is $2897.32 based on our 1-hour chart analysis. Let’s break down the key technical levels that traders should be aware of.
Ethereum ETH USDT price action continues to favor upside potential based on key technical indicators. Scaling into longevity around support levels makes sense. But traders should also watch for divergence signals or potential bearish reversals on lower timeframes. Maintaining a flexible approach as volatility increases will be important.
ETH USDT Technical Analysis
Fibonacci Retracement Levels
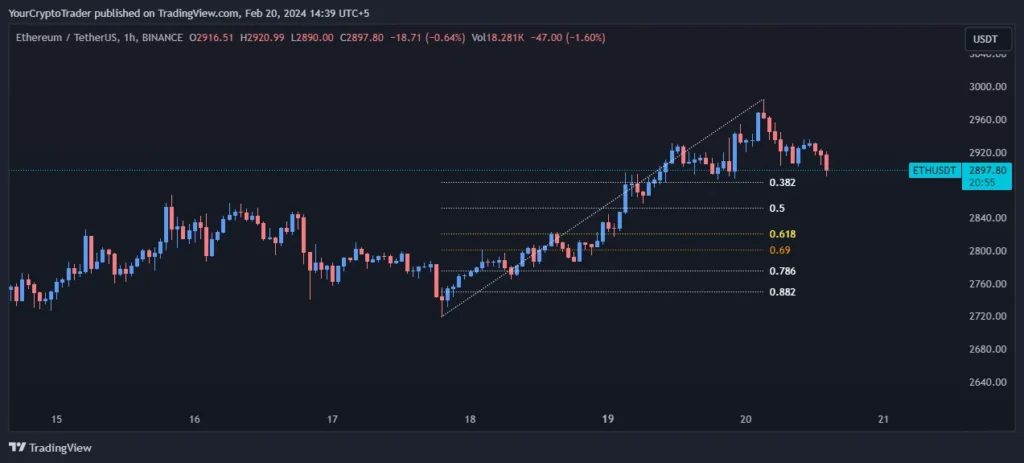
We have identified several Fibonacci retracement levels based on the recent swing high and low. The 0.382, 0.500, and 0.618 Fibonacci retracement levels fall at $2883.37, $2851.77, and $2820.25 respectively. A break below the 0.618 level at $2820.25 could indicate further downside pressure. Meanwhile, a bounce off these levels could fuel another leg higher.
| Fib Retracement Value | Price |
| 0.382 Fib Level | 2883.37 |
| 0.500 Fib Level | 2851.77 |
| 0.618 Fib Level | 2820.25 |
| 0.786 Fib Level | 2775.98 |
| 0.882 Fib Level | 2750.27 |
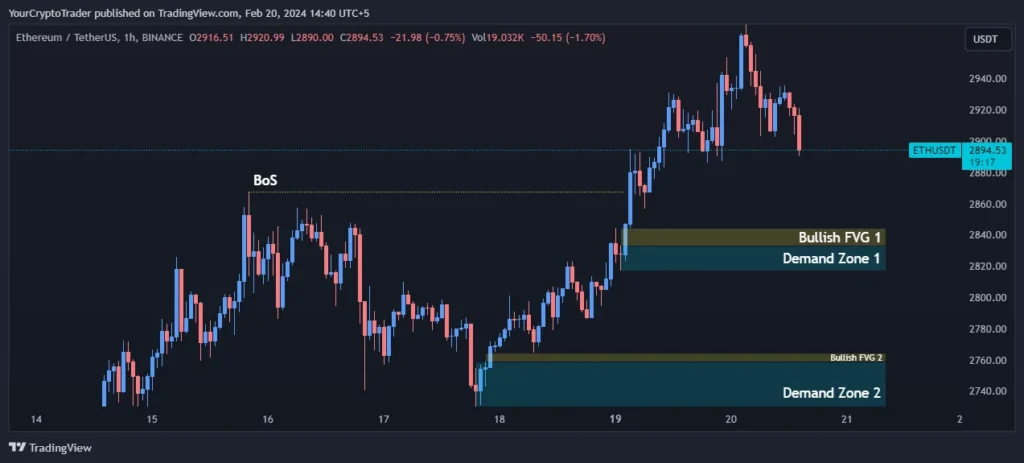
Demand Zones
Looking left at previous consolidation patterns, we see demand zones forming a floor of support. The first demand zone is between $2832.91-$2817.09. Holding above this zone keeps the short-term bullish bias intact. The next demand zone sits lower between $2758.57-$2719.01. A break below $2719.01 would invalidate the upside momentum.
Fair Value Gaps/Imbalances
| Demand Zone Number | Price High | Price Low |
| Demand Zone 1 | 2832.91 | 2817.09 |
| Demand Zone 2 | 2758.57 | 2719.01 |
Fair Value Gaps / Imbalances (FVG)
Analyzing areas where the price did not trade due to an imbalance, we see bullish fair value gaps. The closest gap is between $2844.26-$2832.91. Holding above this keeps near-term price action constructive. Another gap sits higher between $2764.25-$2758.57, which could see a retest if momentum continues.
| FVG Zone Number | Price High | Price Low |
| Bullish FVG 1 | 2844.26 | 2832.91 |
| Bullish FVG 2 | 2764.25 | 2758.57 |
Exponential Moving Averages (EMA) Levels
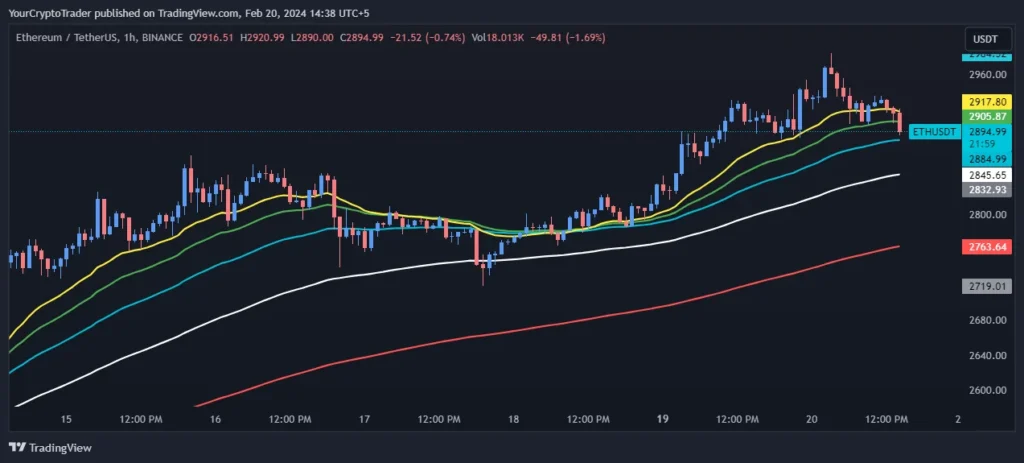
Looking at the trend on multiple timeframes, the shorter EMAs are holding above the longer EMAs confirming an uptrend is in play. Specifically, the 21 and 34 EMAs are flattening out around $2900 as bulls take a breather. As long as we hold above the 100 EMA ($2847.75), shorts should cover on dips. Strong support is found at the 200 EMA ($2763.68).
| EMA Type | EMA Price on Chart |
| 200 EMA (Red Color) | 2763.68 |
| 100 EMA (White Color) | 2847.75 |
| 55 EMA (Blue Color) | 2885.10 |
| 34 EMA (Green Color) | 2906.17 |
| 21 EMA (Yellow Color) | 2918.35 |
Fixed Range Volume Profile Levels
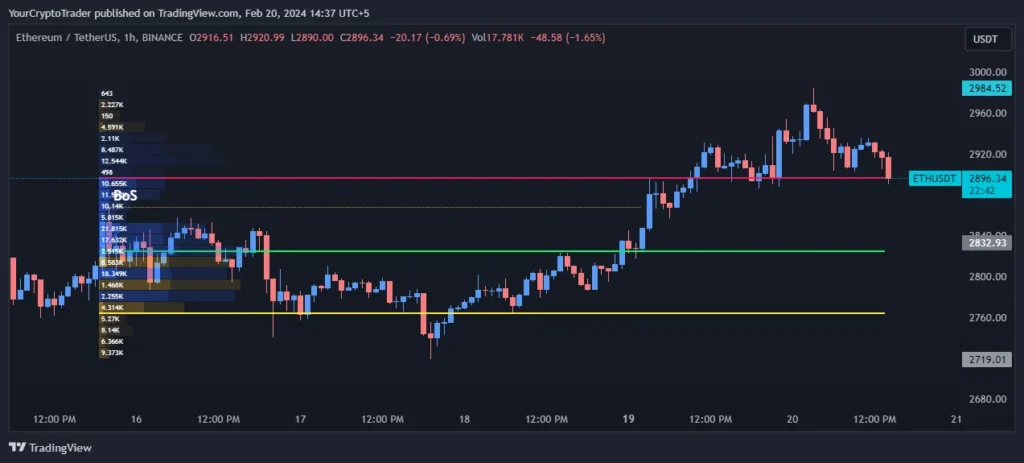
Analyzing the Fixed Range Volume Profile, we see the Point of Control or “fair price” is at $2825.23 with the Value Area ranging from $2763.57-$2896.67. This indicates sellers are defending the $2800 level while buyers are absorbing volume higher. A break above $2896.67 could see increased buying pressure emerge.
| Point of Control (POC) | Value Area High (VAH) | Value Area Low (VAL) |
| 2825.23 | 2896.67 | 2763.57 |
ETHUSDT Trade Bias
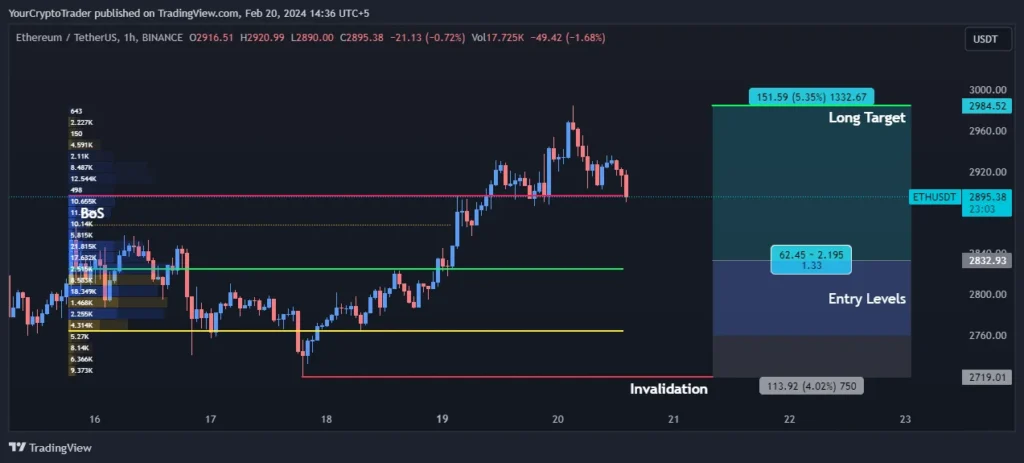
Based on the confluence of signals across timeframes as well as the position of EMAs and demand zones, we believe the current trade bias is long. Positioning for further upside potential makes sense as long as we hold key support.
Trade Bias: Long
ETHUSDT Entry Levels
Traders can look to enter long positions on dips toward the demand zone between $2832.93-$2817.09. An alternative entry sits slightly lower at $2758.68, with tight stops below $2719.01. Risk management will be important as volatility may increase around these levels.
| Entry Level Zone Number | Entry Level Price |
| Entry Levels 1 | 2832.93 |
| Entry Levels 2 | 2758.68 |
ETHUSDT Invalidation Levels
The current invalidation level for any long positions is set at the lower demand zone of $2719.01. A four-hour close below this point would suggest the bullish thesis is no longer valid and one would exit long trades. Traders should be mindful of protecting their capital by using proper risk management.
| Invalidation Type (Long, Short) | Invalidation Price |
| Long | 2719.01 |
ETHUSDT Target Levels
If bulls can push the price above the 21 EMA around $2918, the next major target is the all-time high at $2984.26. Scaling partial profits into strength is advised to lock in profits while allowing runners. Overall, the uptrend remains intact as long as we hold above $2719 support
| Target Level | Target Price |
| Long Target | 2984.26 |
Disclaimer: This analysis is for informational purposes only and should not be considered financial advice. Please do your own research before making any trading decisions.