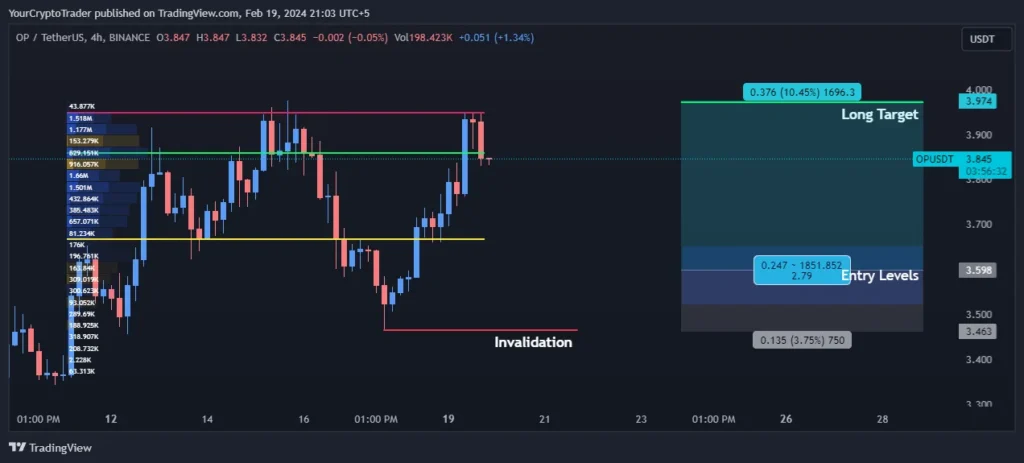
Optimism (OP USDT) is currently trading at $3.842 on the 4H chart. Let us take a deeper look at the key technical levels that could provide insight into OP’s near term price action.
OP USDT shows indications of basing out after the recent correction, with key levels identified on both sides. Patience will be needed for technical confirmation of an upside resumption. Risk management discipline becomes paramount in range bound markets.
OP USDT Technical Analysis
Support Levels
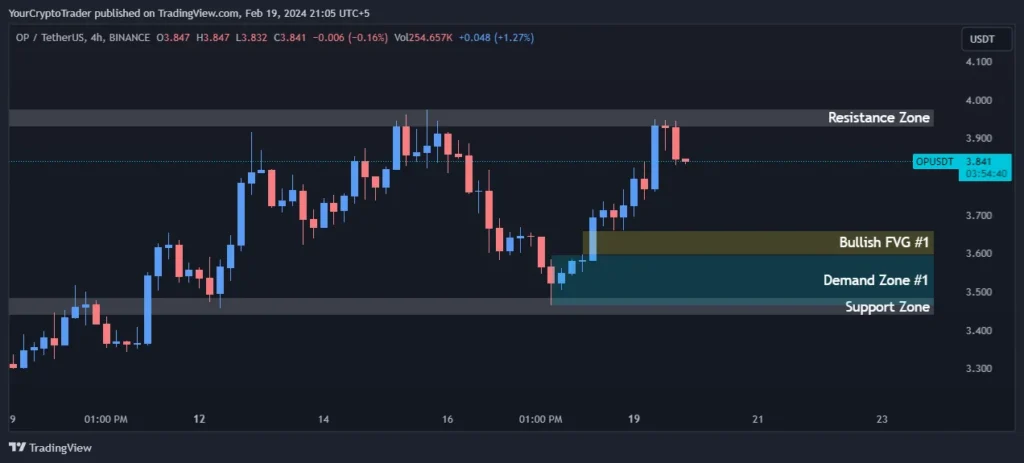
The first major supportive zone lies between $3.439 – $3.485. This zone encapsulates the recent swing lows, making it a crucial area to hold for the bulls. A breakdown below this could see prices retrace further towards secondary support at $3.392 (200 EMA).
| Support Zone Number | Price High | Price Low |
| Support Zone | 3.439 | 3.485 |
Resistance Levels
Resistance is seen in the $3.931 – $3.977 zone. This area matches up with prior swing highs and has repeatedly capped rallies in the past. For the bullish momentum to continue on the 4H chart, OP USDT will need to make a convincing move above this resistance range.
| Resistance Zone Number | Price High | Price Low |
| Resistance Zone | 3.931 | 3.977 |
Fibonacci Retracement Levels
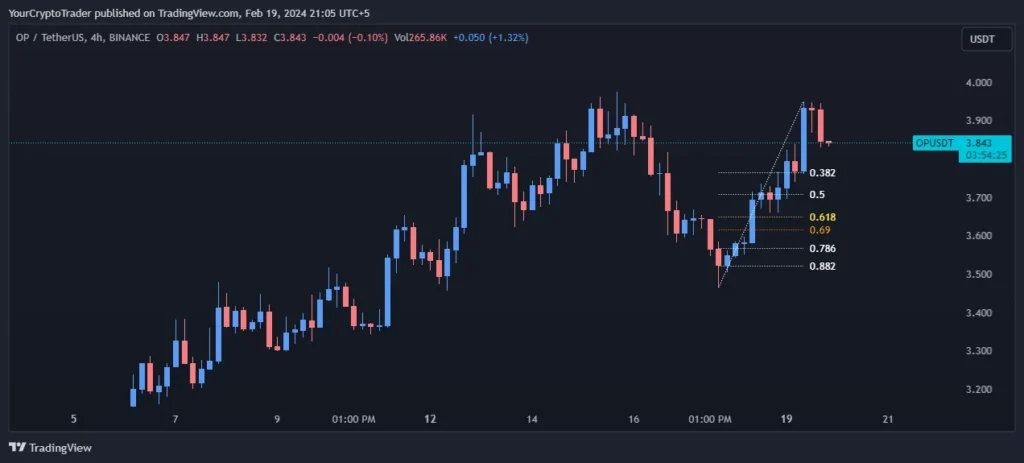
Fib Retracement levels provide guidance on potential correction areas as well as inflection points. After the recent rally, OP has pulled back and found support at the 0.382 Fib retracement level of $3.765. Additional supports are seen at 0.5 Fib ($3.708), 0.618 Fib ($3.650) and 0.786 Fib ($3.569). Holding above these levels signals the bulls remain in control of the medium term trend.
| Fib Retracement Value | Price |
| 0.382 Fib Level | 3.765 |
| 0.50 Fib Level | 3.708 |
| 0.618 Fib Level | 3.650 |
| 0.786 Fib Level | 3.569 |
| 0.882 Fib Level | 3.521 |
Demand Zones
Demand zones indicate price ranges that attracted significant buying volume in the past. One such zone lies between $3.597 – $3.464 and could act as an area of interest on future dips. Holding above this zone bodes well for bulls defending the uptrend.
| Demand Zone Number | Price High | Price Low |
| Demand Zone | 3.597 | 3.464 |
Fair Value Gaps / Imbalances (FVG)
FVG highlights periods where price gaps away from fair value. OP shows a bearish gap between $3.597 – $3.659 which if filled, could provide a lower risk entry. Breaking above this zone removes near term bearish pressure.
| FVG Zone Number | Price High | Price Low |
| Bearish FVG | 3.597 | 3.659 |
Exponential Moving Averages (EMA) Levels
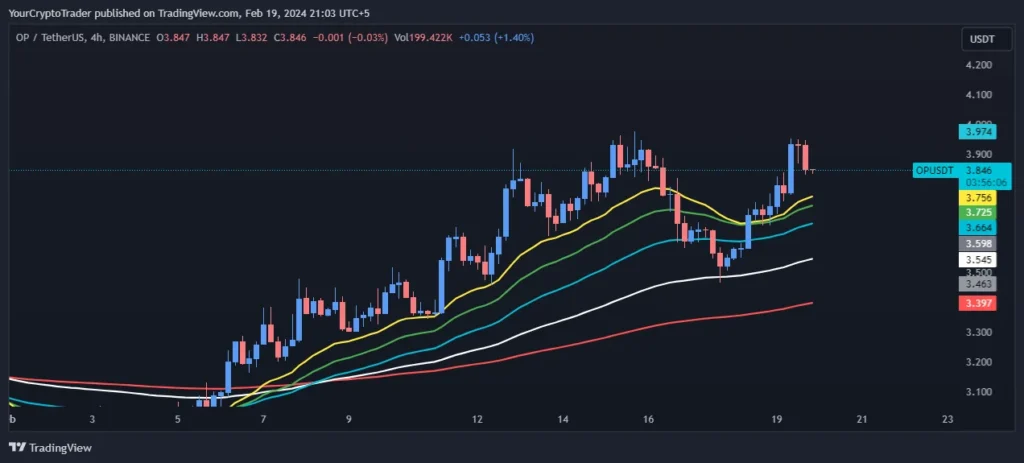
Moving averages provide trend indications based on recent price action. While below the 21 EMA ($3.746), the path of least resistance remains down. A convincing move above this level signals a potential bullish divergence has formed on the shorter timeframes. The 200 EMA at $3.392 is a crucial line in the sand for longer term bulls.
| EMA Type | EMA Price on Chart |
| 200 EMA (Red Color) | 3.392 |
| 100 EMA (White Color) | 3.539 |
| 55 EMA (Blue Color) | 3.657 |
| 34 EMA (Green Color) | 3.717 |
| 21 EMA (Yellow Color) | 3.746 |
Fixed Range Volume Profile Levels
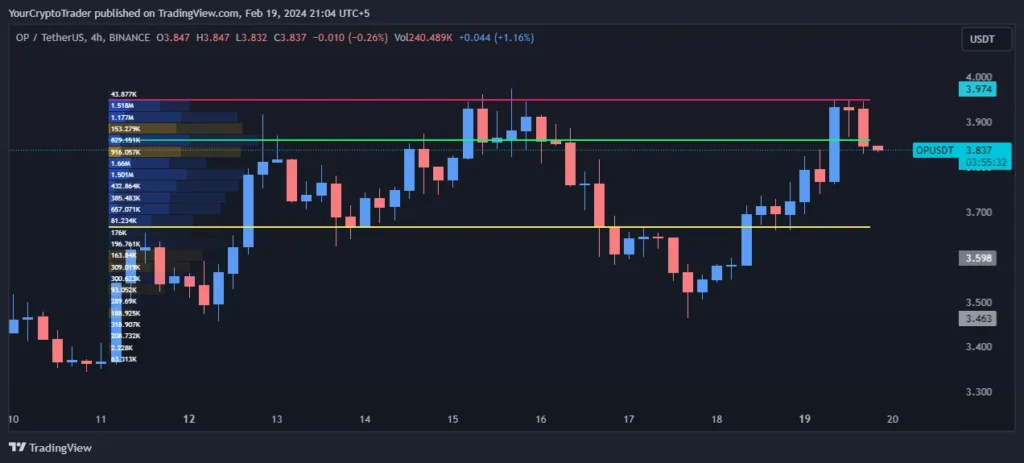
Volume profile shows price congestion zones and reveals potential demand/supply areas. The current POC is at $3.859 which if broken decisively, shows increasing buying momentum. The value area ranges from $3.671- $3.951 with the lower VAL acting as support.
| Point of Control (POC) | Value Area High (VAH) | Value Area Low (VAL) |
| 3.859 | 3.951 | 3.671 |
Trade Bias
The configuration of technical indicators points to a cautiously bearish short term bias with supports forming around the key demand zones and Fib retracement levels mentioned earlier. A break above the descending resistance trendline and 21 EMA validates a shift to a bullish bias above $3.746.
Trade Bias: Long
Entry Levels
Potential long entry opportunities exist in the demand zone between $3.522 – $3.652. Earlier buying interest in this range makes it an area of interest on dip. Tight stops below $3.464 would mitigate downside risk.
| Entry Level Zone Number | Entry Level Price |
| Entry Levels 1 | 3.652 |
| Entry Levels 2 | 3.522 |
Invalidation Levels
A breakdown below the major demand zone support of $3.464 would invalidate the bullish case and potentially lead to a deeper retracement of the recent rally towards the 200 EMA. Long positions should be excited if support is lost to avoid bigger drawdowns.
| Invalidation Type (Long, Short) | Invalidation Price |
| Long | 3.464 |
Target Levels
If the bull breakout is sustained, the initial target lies at the resistance turn of $3.971 with upside extended towards the upper value area at $3.951. Trailing stops can be employed to lock in profits and remain flexible to changing market conditions.
| Target Level | Target Price |
| Long Target | 3.971 |