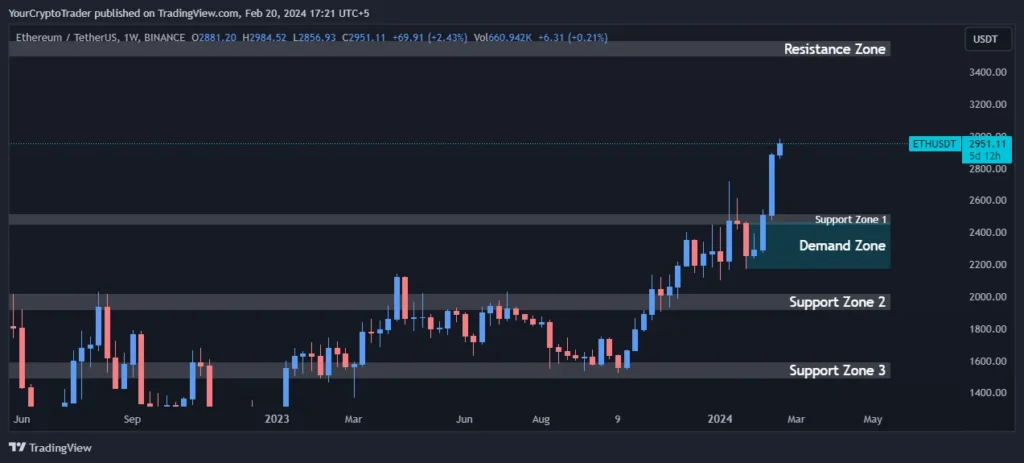
Currently, ETH USDT is trading at $2897.32. The coin finds strong support between $2447-$2516 which is Support Zone 1. Additional support lies in Zone 2 between $1917-$2020 and Zone 3 between $1490-$1593.
As long as ETH USDT holds above the key support levels, the technical outlook remains bullish. A break below $2480 could see it retest lower levels. Immediate resistance is seen at $3493-$3596.
ETH USDT Technical Analysis
Support Levels
Ethereum ETH USDT has strong support zones between 2447-2515, 1916-2019, and 1489-1592 levels. A break below 1489 could see further downside towards the next support of 1240.
| Support Zone Number | Price High | Price Low |
| Support Zone 1 | 2447.02 | 2515.65 |
| Support Zone 2 | 1916.72 | 2019.84 |
| Support Zone 3 | 1489.53 | 1592.65 |
Resistance Levels
On the upside, resistance is seen between $3493-$3596 which is the Resistance Zone. If price is able to break above this level, it will face less selling pressure and could rally further.
| Resistance Zone Number | Price High | Price Low |
| Resistance Zone | 3492.90 | 3596.01 |
Fibonacci Retracement Levels
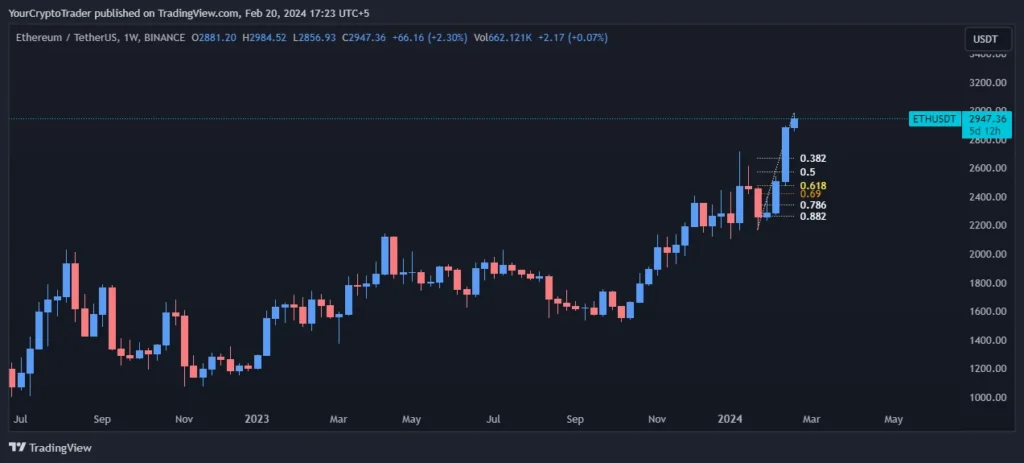
Looking at the Fibonacci retracement levels, the 0.382, 0.500 and 0.618 Fib levels provide support at $2673, $2578 and $2480 respectively. A break below the 0.618 level could see price test the 0.786 Fib level of $2344.
| Fib Retracement Value | Price |
| 0.382 Fib Level | 2673.19 |
| 0.500 Fib Level | 2577.97 |
| 0.618 Fib Level | 2480.18 |
| 0.786 Fib Level | 2343.79 |
| 0.882 Fib Level | 2266.59 |
Demand Zones
The Demand Zone between $2466-$2168 shows where long-term buyers tend to enter the market. Breaking and holding above this zone will be bullish.
| Demand Zone Number | Price High | Price Low |
| Demand Zone | 2466.10 | 2168.07 |
Exponential Moving Averages (EMA) Levels
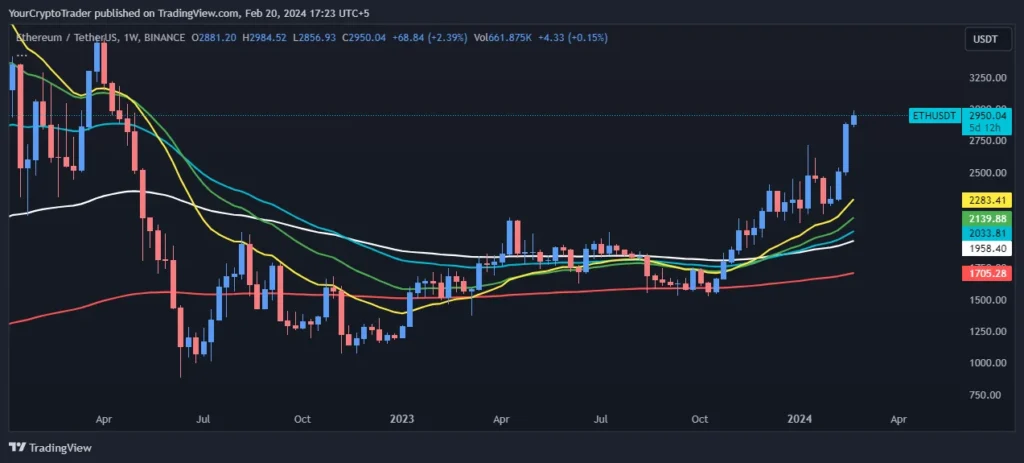
The short-term moving averages like the 21, 34 and 55 EMAs are currently in an uptrend showing near-term momentum is positive. Price is also trading well above the longer-term 100 and 200 EMAs reflecting an established uptrend.
| EMA Type | EMA Price on Chart |
| 200 EMA (Red Color) | 1705.15 |
| 100 EMA (White Color) | 1958.14 |
| 55 EMA (Blue Color) | 2033.34 |
| 34 EMA (Green Color) | 2139.11 |
| 21 EMA (Yellow Color) | 2282.17 |
Fixed Range Volume Profile Levels
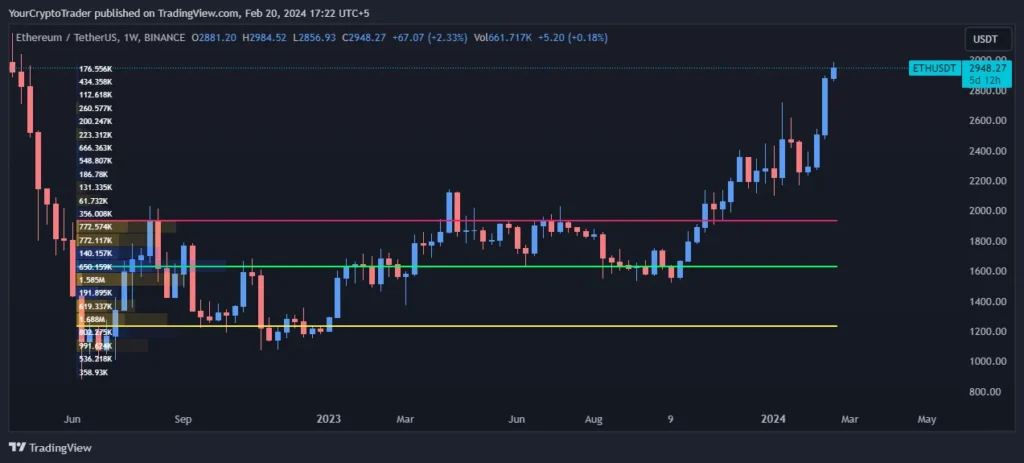
The Volume Profile shows the Point of Control or price with highest trading volume is at $1631. The Value Area High of $1941 and Low of $1231 indicate where most of the volume has traded over the given time period.
| Point of Control (POC) | Value Area High (VAH) | Value Area Low (VAL) |
| 1631.19 | 1940.98 | 1230.60 |
Disclaimer: This analysis is for informational purposes only and should not be considered financial advice. Please do your own research before making any trading decisions.