The technical setup based on the confluences from different timeframe suggests an overall bullish bias for ETH USDT above 2874.56, with upside potential to 3031.99 on a break above resistances. Support between 2889.36-2876.05 needs to hold to retain this view. Monitoring additional momentum indicators would also be advised.
The current price of ETH/USDT is 2921.29. Let’s analyze the key support and resistance levels:
ETH USDT Technical Analysis
Support Levels
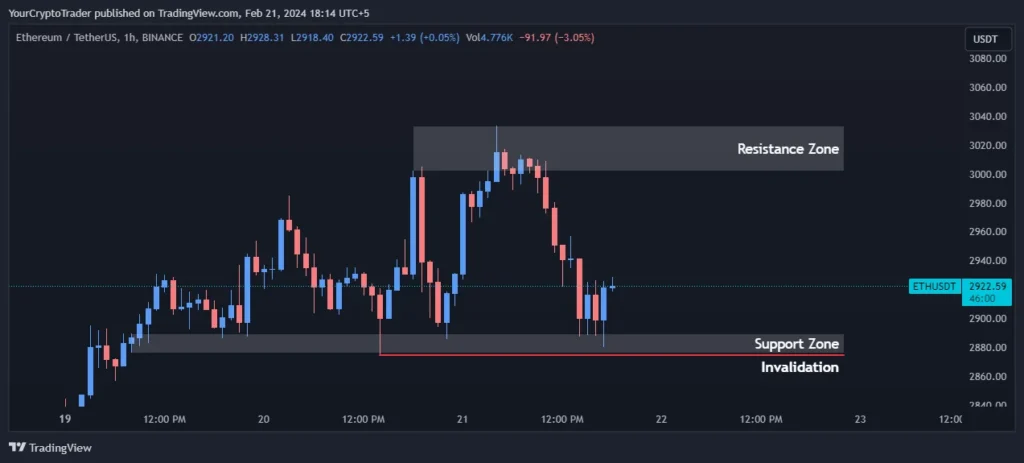
The key support zone is between 2889.36-2876.05. This zone shows an area of significant demand where buyers have been active in the past. A bounce off this zone would indicate strong support.
| Support Zone Number | Price High | Price Low |
| Support Zone | 2889.36 | 2876.05 |
Resistance Levels
The major resistance zone is between 3033.09-3001.78. This area has acted as a ceiling in the past, with sellers stepping in to limit upside momentum. A break above this zone could push prices higher.
| Resistance Zone Number | Price High | Price Low |
| Resistance Zone | 3033.09 | 3001.78 |
Exponential Moving Averages (EMA) Levels
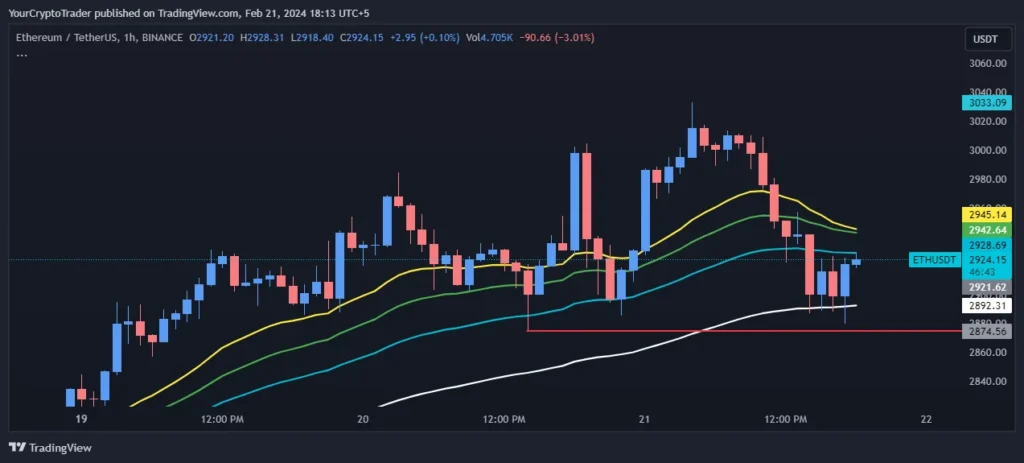
The EMA levels provide insight into short, medium and long-term trends. The 21 EMA at 2944.72 is currently acting as near-term support. A hold above the 200 EMA at 2810.31 signals an overall bull market.
| EMA Type | EMA Price on Chart |
| 200 EMA (Red Color) | 2810.31 |
| 100 EMA (White Color) | 2892.32 |
| 55 EMA (Blue Color) | 2928.24 |
| 34 EMA (Green Color) | 2942.42 |
| 21 EMA (Yellow Color) | 2944.72 |
Fixed Range Volume Profile Levels
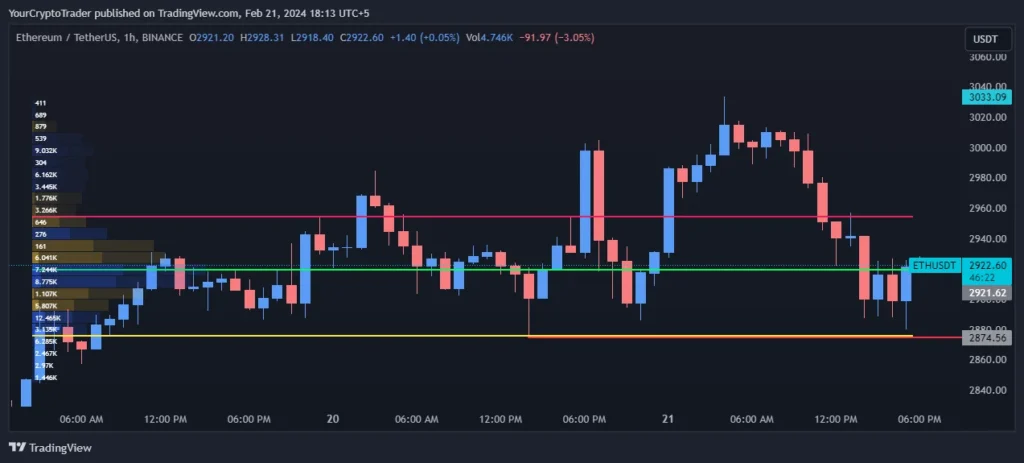
The POC at 2919.23 shows an area of equilibrium. The narrow VAL between 2876.56-2954.67 signals a tight potential trading range. The wider the range, the more volatile the price could be.
| Point of Control (POC) | Value Area High (VAH) | Value Area Low (VAL) |
| 2919.23 | 2954.67 | 2876.56 |
Trade Bias
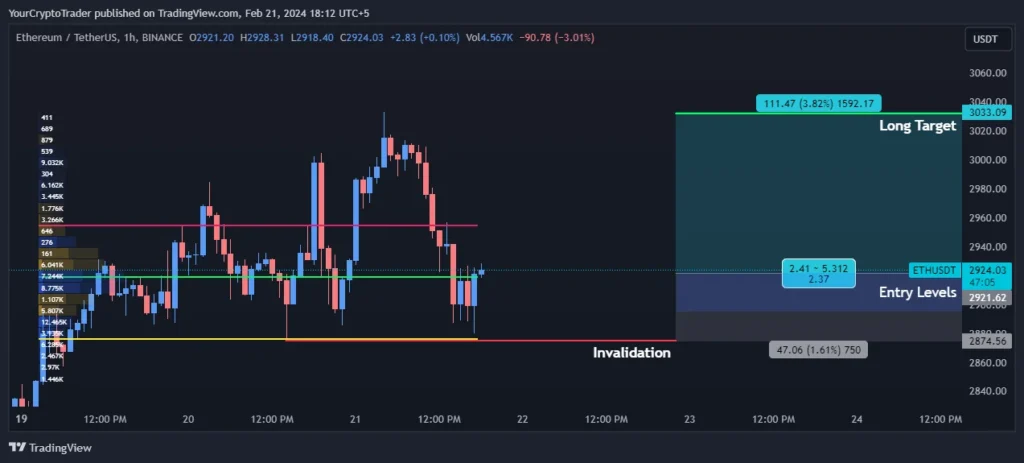
The current bias is long based on ETH holding above important support zones and EMA levels. A close below 2874.56 invalidates the long bias.
Trade Bias: Long
Entry Levels
Two potential entry zones are provided between 2922.08-2894.97. The first long target is at 3031.99. Proper risk management with stops below key support applies.
| Entry Level Zone Number | Entry Level Price |
| Entry Levels 1 | 2922.08 |
| Entry Levels 2 | 2894.97 |
Invalidation Levels
| Invalidation Type (Long, Short) | Invalidation Price |
| Long | 2874.56 |
Target Levels
| Target Level | Target Price |
| Long Target | 3031.99 |
Disclaimer: This analysis is for informational purposes only and should not be considered financial advice. Please do your own research before making any trading decisions.