The price action and technical indicators are currently pointing to downside potential for SOL USDT based on the supply zone resistance, bearish EMA picture, and short trade bias. A break below the Fibonacci support levels could spur short positions toward the profit targets.
Upside will face resistance at the supply zone and trendlines. Traders are advised to watch the EMA levels and supply zone for potential short setups in the near term.
The current price of SOL USDT is trading at 104.80. There are a few key levels and indicators that traders will be watching:
SOL USDT Technical Analysis
Fibonacci Retracement Levels
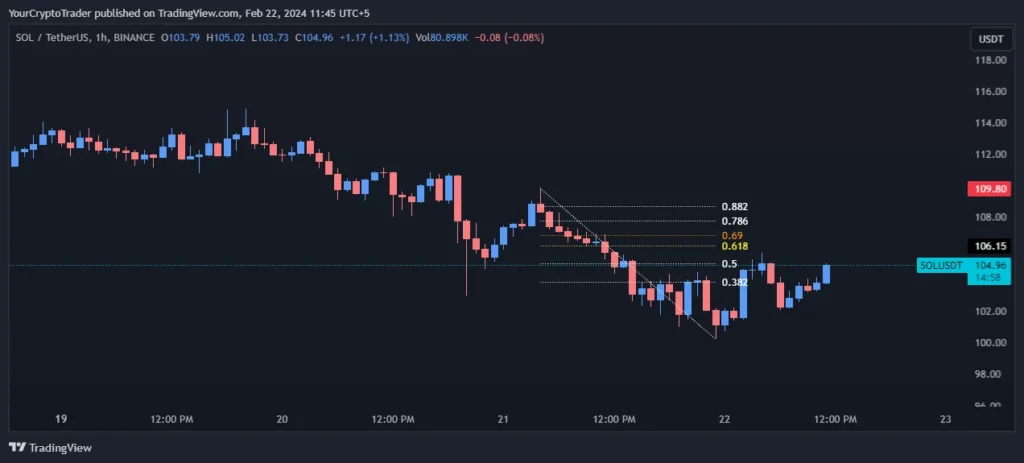
The 0.382, 0.500, and 0.618 Fibonacci retracement levels fall between 103.90-106.15. A break below these levels could point to further downside pressure for SOL USDT.
| Fib Retracement Value | Price |
| 0.382 Fib Level | 103.90 |
| 0.500 Fib Level | 105.1 |
| 0.618 Fib Level | 106.15 |
| 0.786 Fib Level | 107.71 |
| 0.882 Fib Level | 108.65 |
Supply Zones
There is a notable supply zone between 106.16-106.92. This area had previously acted as resistance and may now act as an upside barrier. A failure to break above this zone would favor the bears.
| Supply Zone Number | Price High | Price Low |
| Supply Zone | 106.16 | 106.92 |
Exponential Moving Averages (EMA) Levels
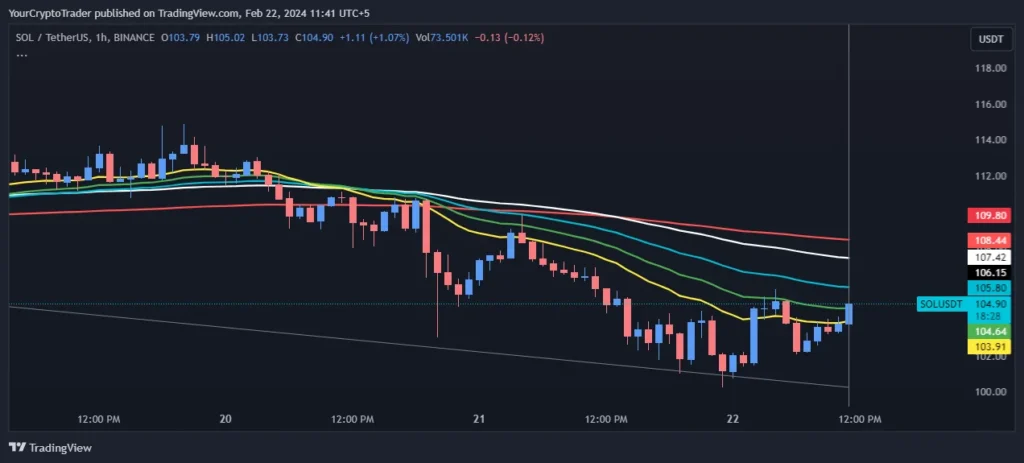
The short term EMAs of 21, 34, and 55 are below the mid-term 100 and 200 EMAs, indicating a short-term bearish bias. The price would need to close and sustain above the 100 EMA for this bias to turn neutral bullish.
| EMA Type | EMA Price on Chart |
| 200 EMA (Red Color) | 108.44 |
| 100 EMA (White Color) | 107.42 |
| 55 EMA (Blue Color) | 105.80 |
| 34 EMA (Green Color) | 104.64 |
| 21 EMA (Yellow Color) | 103.91 |
Fixed Range Volume Profile Levels
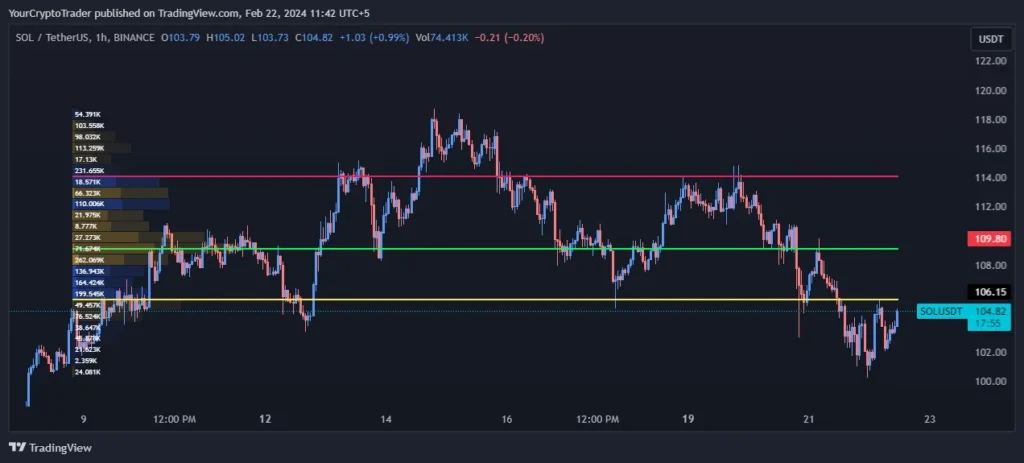
The key focus will be on holding the VAL support level and breaking past the POC resistance. As the current price is slightly below the POC, bears currently have the slight edge. However, buyers may look to defend the VAL and try pushing the price back above the POC support turned resistance.
Traders can look for range breakouts on either side for potential momentum moves. The next resistance above remains the significant VAH level.
| Point of Control (POC) | Value Area High (VAH) | Value Area Low (VAL) |
| 109.19 | 114.06 | 105.67 |
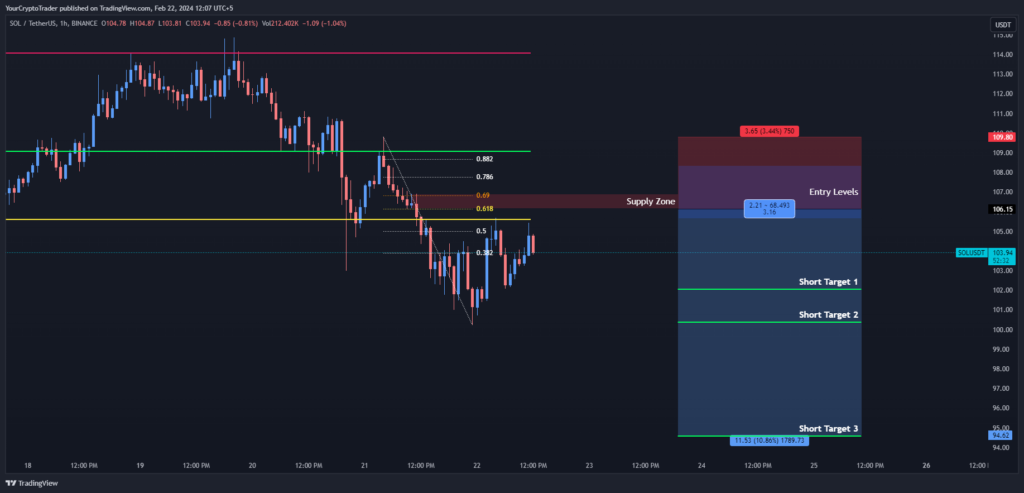
Trade Bias
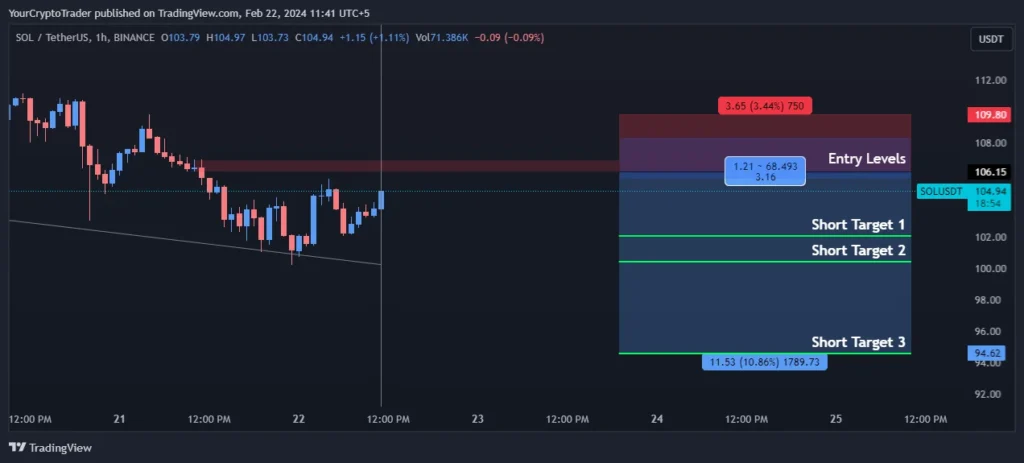
The overall trade bias is noted as short based on the chart patterns and indicators. Traders are looking for short opportunities with entry levels of 105.66 and 108.35. Profit targets of 102.05, 100.39, and 94.58 are provided
Trade Bias: Short
Entry Levels
| Entry Level Zone Number | Entry Level Price |
| Entry Levels 1 | 105.66 |
| Entry Levels 2 | 108.35 |
Target Levels
| Target Level | Target Price |
| Short Target 1 | 102.05 |
| Short Target 2 | 100.39 |
| Short Target 3 | 94.58 |
Disclaimer: This analysis is for informational purposes only and should not be considered financial advice. Please do your own research before making any trading decisions.