The current price of SOL USDT is trading at $104.17. Based on the technical indicators, the overall market structure and momentum signals, the short term trade bias for SOL USDT is short.
The short bias remains intact below $115.08 with downside targets of $100.22 and $94.67 on further weakness. Traders can look to enter short rallies closer to the outlined resistance levels.
SOL USDT Technical Analysis
Support Levels
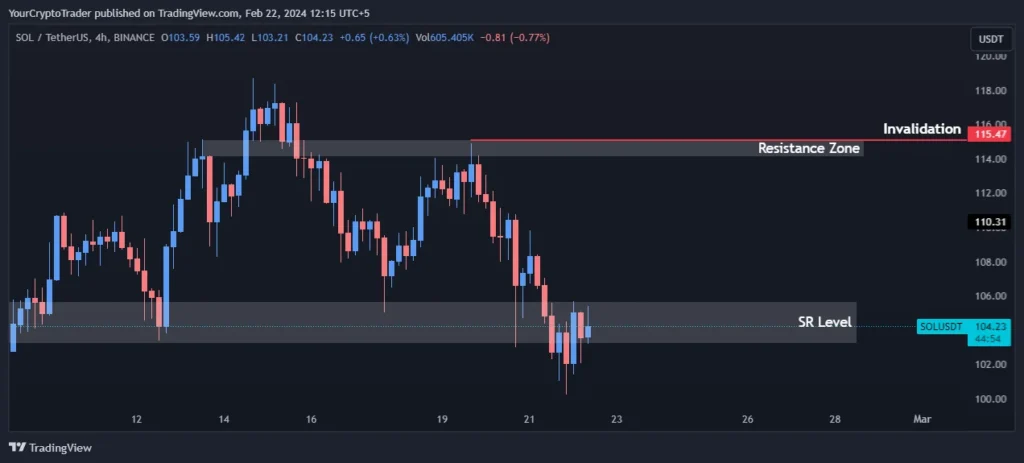
There is a strong support zone between $103.25-$105.69. Price action has respected this level multiple times in the past and any consolidation or bounce from this zone would be a good opportunity to enter short positions.
| Support Zone Number | Price High | Price Low |
| SR Level | 103.25 | 105.69 |
Resistance Levels
The immediate resistance levels are at $114.14-$115.15. A break above this resistance could invalidate the short term short bias.
| Resistance Zone Number | Price High | Price Low |
| Resistance Zone | 114.14 | 115.15 |
Fibonacci Retracement Levels
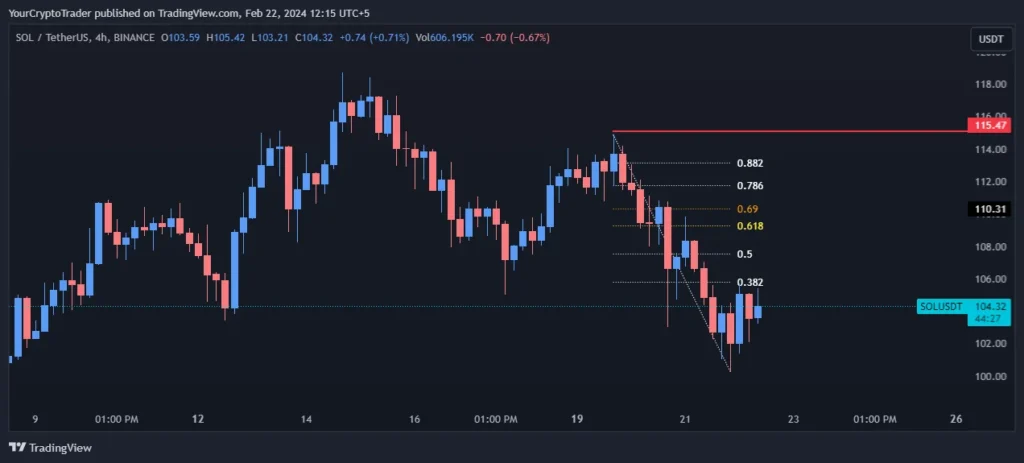
The 0.382, 0.500 and 0.618 Fibonacci retracement levels from the recent swing high to low are at $105.81, $107.57 and $109.29 respectively. These levels could provide some resistance on any bounce up from current levels.
| Fib Retracement Value | Price |
| 0.382 Fib Level | 105.81 |
| 0.500 Fib Level | 107.57 |
| 0.618 Fib Level | 109.29 |
| 0.786 Fib Level | 111.75 |
| 0.882 Fib Level | 113.14 |
Exponential Moving Averages (EMA) Levels
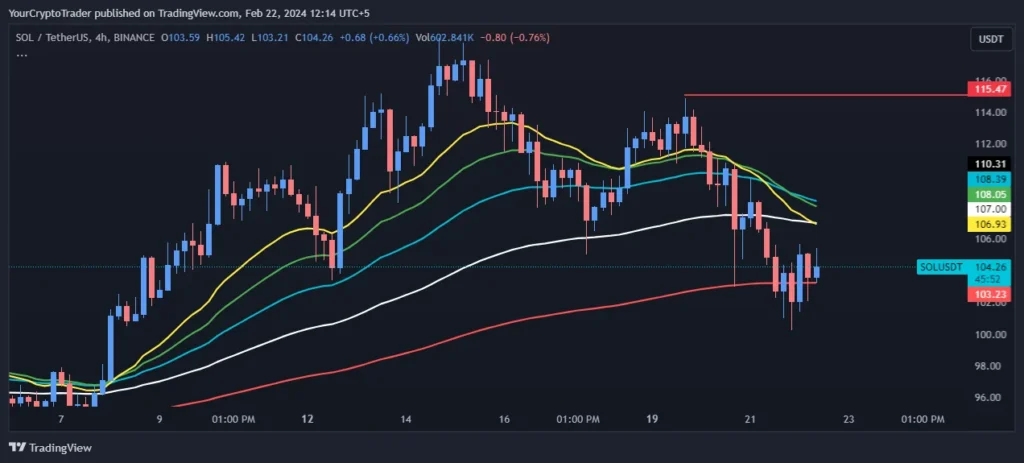
All the short term EMAs (21, 34, 55 EMA) are bearings below the 200 EMA indicating short term momentum is turning down. This adds strength to the bearish bias.
| EMA Type | EMA Price on Chart |
| 200 EMA (Red Color) | 103.23 |
| 100 EMA (White Color) | 107.00 |
| 55 EMA (Blue Color) | 108.39 |
| 34 EMA (Green Color) | 108.05 |
| 21 EMA (Yellow Color) | 106.93 |
Fixed Range Volume Profile Levels
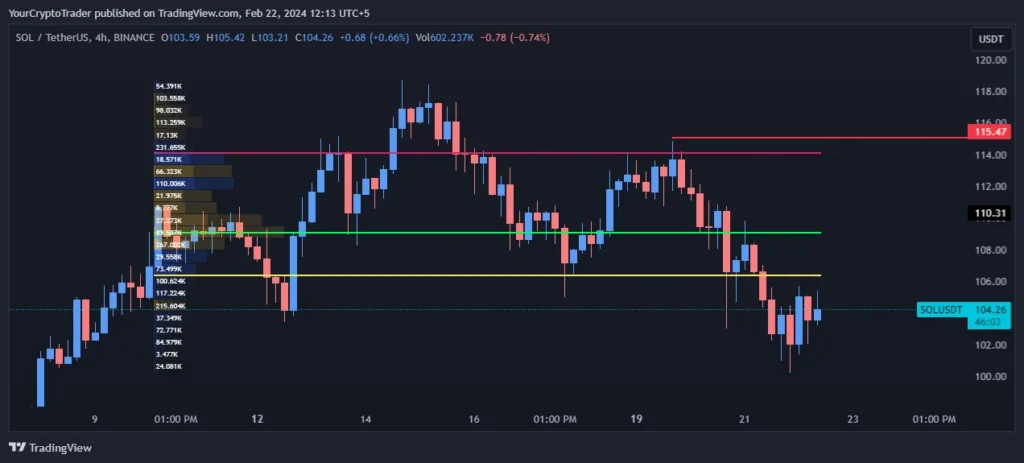
The Point of Control (POC) is at $109.10 which also coincides with the upper boundary of the Value Area Low (VAL) of $106.38- $114.07. This zone should act as stiff resistance.
| Point of Control (POC) | Value Area High (VAH) | Value Area Low (VAL) |
| 109.10 | 114.07 | 106.38 |
Trade Bias
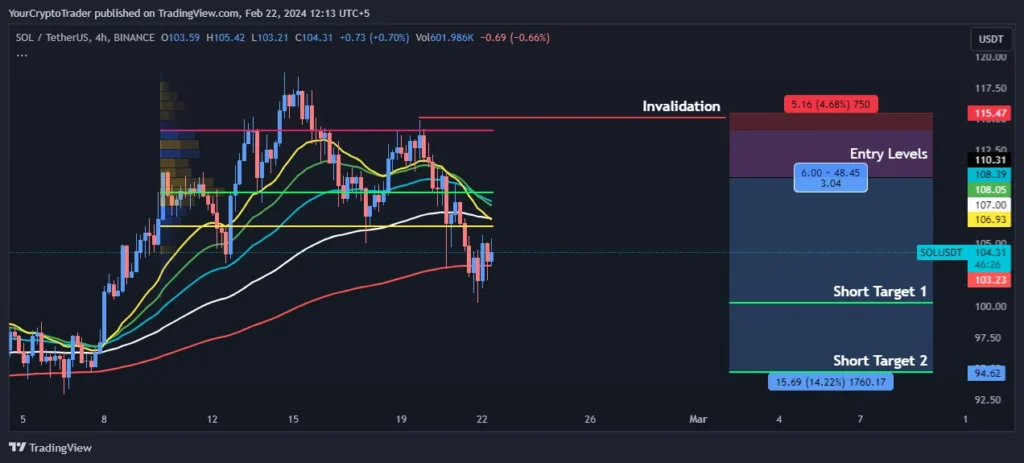
Based on the confluence of lower highs, bearish momentum signals and volume profile, the trade bias is short with entry levels at $114.13 and $110.31.
Trade Bias: Short
Entry Levels
| Entry Level Zone Number | Entry Level Price |
| Entry Levels 1 | 114.13 |
| Entry Levels 2 | 110.31 |
Invalidation Levels
If price rises above $115.08, it will invalidate the short term short bias.
| Invalidation Type (Long, Short) | Invalidation Price |
| Short | 115.08 |
Target Levels
Short term targets are seen at $100.22 and $94.67 based on extensions of recent price action swings and historical support/resistance flip levels.
| Target Level | Target Price |
| Short Target 1 | 100.22 |
| Short Target 2 | 94.67 |
Disclaimer: This analysis is for informational purposes only and should not be considered financial advice. Please do your own research before making any trading decisions.