ADA USDT is attempting an upside breakout after recent ranging. Its fundamental growth drivers point to a positive long term trajectory. But the crypto needs to surmount immediate supply to signal a short term shift in momentum. Traders may wait for evidence of short-term strength before entering fresh long positions. Upside potential opens up on a daily close above the key $0.5493 resistance level.
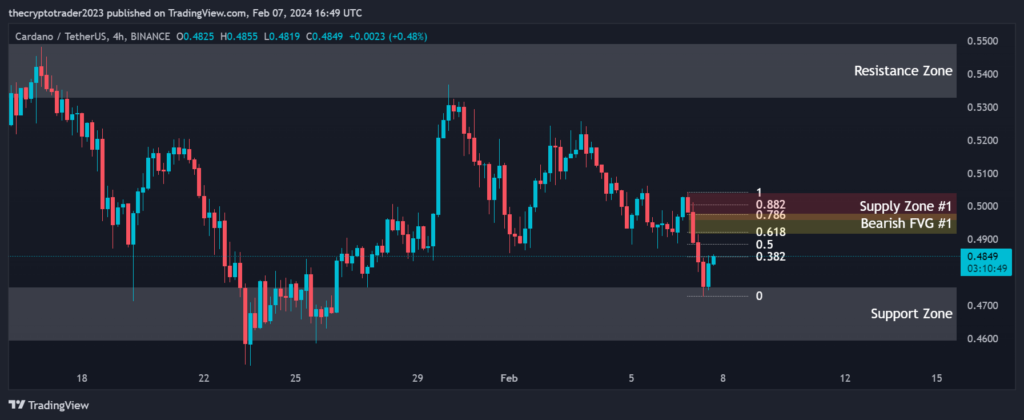
On the 4-hour chart, ADA USDT is finding support within the $0.4592-$0.4758 zone after testing this level yesterday. Immediate resistance lies at $0.5327-$0.5493. The price is currently contending with the 0.382 Fibonacci retracement level of $0.4848. A break above this level could see the crypto rise to test the next resistance levels between $0.4922-0.5042 which overlaps with the supply zone. As mentioned in the context, Cardano’s fundamentals have strengthened following recent code updates that add smart contract functionality. This potentially improves its long term growth prospect
Support and Resistance Levels
S / R Type
High
Low
Support Zone
0.4592
0.4758
Resistance Zone
0.5327
0.5493
Fibonacci Retracement Levels
0.382
0.4848
0.50
0.4885
0.618
0.4922
0.786
0.4975
0.882
0.5005
Supply Zone
Zone Number
High
Low
Supply Zone
0.4957
0.5042
Fair Value Gaps / Imbalances
Gap Number
High
Low
Bearish FVG
0.4981
0.4915
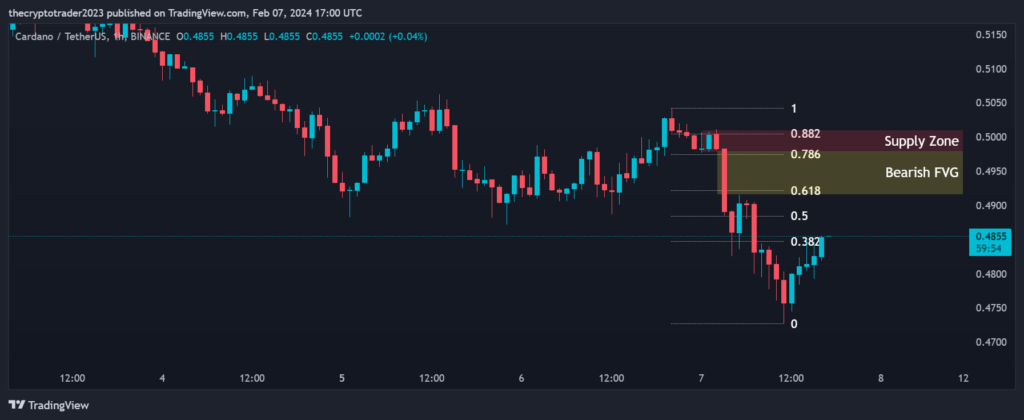
1 Hour Timeframe
Zooming into the 1-hour chart, we can see the bears are defending the $0.4915-$0.4980 zone which mirrors the bearish fair value gap and supply zone. The crypto has struggled to sustain gains above the 0.382, 0.50, 0.618 Fibonacci retracement levels pegged at $0.4848, $0.4884 and $0.4921 respectively. A firm break here could ignite quicker upside towards $0.4974 and $0.5004 resistance. However, failure to hold above could see ADA revisit the $0.4758 support once again in the near-term.