On the 1-hour ADA USDT chart are displaying mixed signals on further upside momentum. Traders should be patient and wait for clear confirmation of a short term directional move above/below the key fib levels before entering any new positions.
Risk management with tight stop losses will also be crucial given the uncertainty at this price point.
The current price of Cardano ADA/USDT trading against the USDT is $0.4941 based on the 1-hour chart data provided. This price level places ADA USDT right at the border between a supply and demand zone.
For a more in-depth technical analysis across different timeframes, please click the link to view the identified levels of support and resistance, trends, and reversal patterns on the weekly, daily, and 4-hour charts.
1 Hour Timeframe
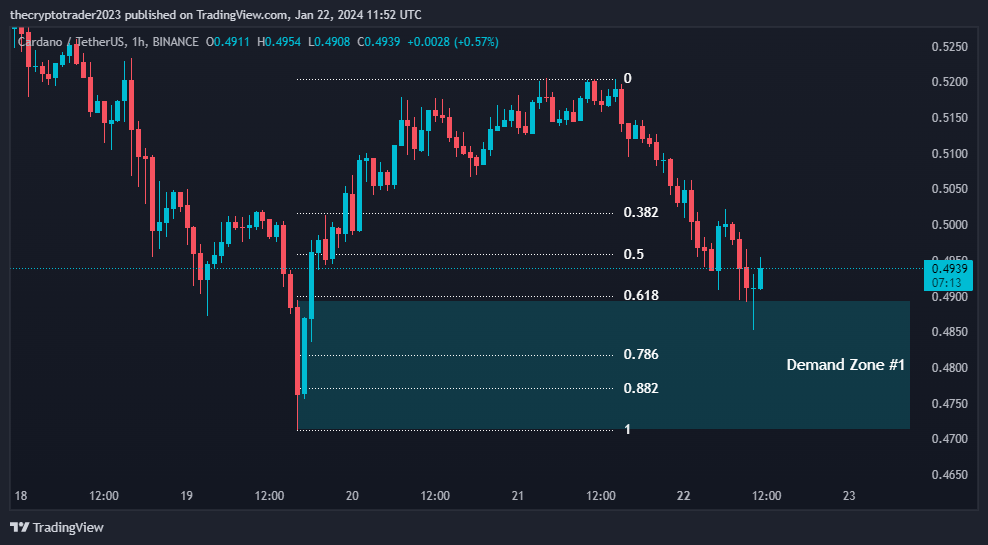
Let’s analyze the trend on this timeframe. In the past few hours, we can see ADA USDT was in an uptrend after consolidating in a range between $0.4713 support and $0.4895 resistance. Prices have formed higher highs and higher lows indicating an uptrend was underway.
However, over the past 1-2 hours the trend seems to be flattening out, with prices trading sideways just above the midpoint of Demand Zone #1 at $0.4800.
Fibonacci Retracement Levels
To identify potential reversal or continuation areas, I have applied the Fibonacci retracement tool to the most recent swing high of $0.5016 down to the local swing low of $0.4713 within Demand Zone #1. The key retracement levels are as follows:
- 38.2% fib level – $0.4959
- 50% fib level – $0.4950
- 61.8% fib level – $0.4900
- 78.6% fib level – $0.4817
With the current price sitting right on top of the 50% fib retracement level, this indicates ADA could be finding short term support for another leg higher within the uptrend. Prices would need to break below $0.4900 for the bullish case to weaken.
| 0.382 | 0.5016 |
| 0.50 | 0.4959 |
| 0.618 | 0.4900 |
| 0.786 | 0.4817 |
| 0.882 | 0.4771 |
Demand Zone
Taking a step back to the hourly chart, we can see Demand Zone #1 identified between $0.4713 and $0.4895 has been a key battleground for buyers and sellers over the past 24 hours. This zone was previously resistance, then flipped to support the uptrend after prices broke above the mid-point of $0.4804.
| Zone Number | High | Low |
| Demand Zone #1 | 0.4895 | 0.4713 |
Going forward, I will be watching for signals that could confirm further upside such as a break above $0.4959 (38.2% fib) on increasing volume.
On the other hand, a breakdown below $0.4900 (61.8% fib) could see prices retest demand zone support again. Strong volume under this level may then signal a short term trend change to the downside.