Technical indicators point to an overall bullish bias for ARB USDT across timeframes, with established support and resistance/supply and demand zones providing trading opportunities.
Weekly Timeframe
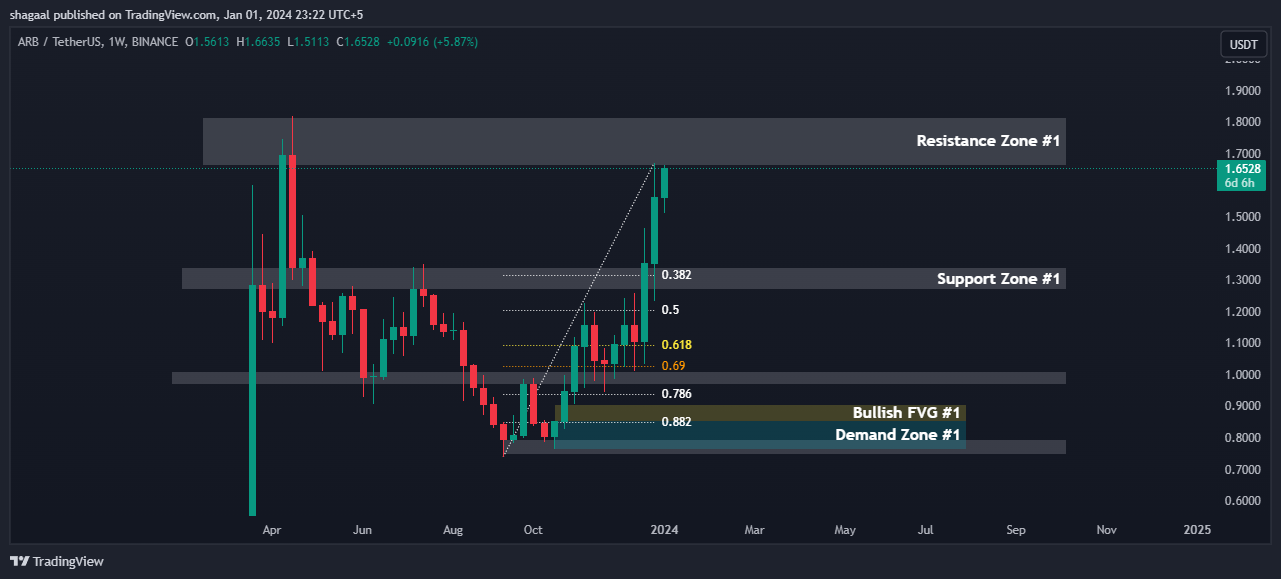
ARB USDT is currently trading between the support zones of 1.2699 and 1.0112 and below the resistance zone of 1.8164. The 0.382, 0.50, and 0.618 Fibonacci retracement levels provide insight into potential reversal areas. Demand zone #1 between 0.8566-0.7634 could attract buyers if price declines. Bullish fair value gap (FVG) #1 between 0.8532-0.9074 indicates upside potential if price rises into this gap.
Support and Resistance Levels
| Support Zone #1 | 1.2699 |
| Support Zone #2 | 1.0112 |
| Support Zone #3 | 0.7946 |
| Resistance Zone #1 | 1.8164 |
Fibonacci Retracement Levels
| 0.382 | 1.3145 |
| 0.50 | 1.2050 |
| 0.618 | 1.0910 |
| 0.786 | 1.9373 |
| 0.882 | 0.8488 |
Demand Zone
| Zone Number | High | Low |
| Demand Zone #1 | 0.8566 | 0.7634 |
Fair Value Gaps / Imbalances
| Gap Number | High | Low |
| Bullish FVG #1 | 0.8532 | 0.9074 |
Daily Timeframe
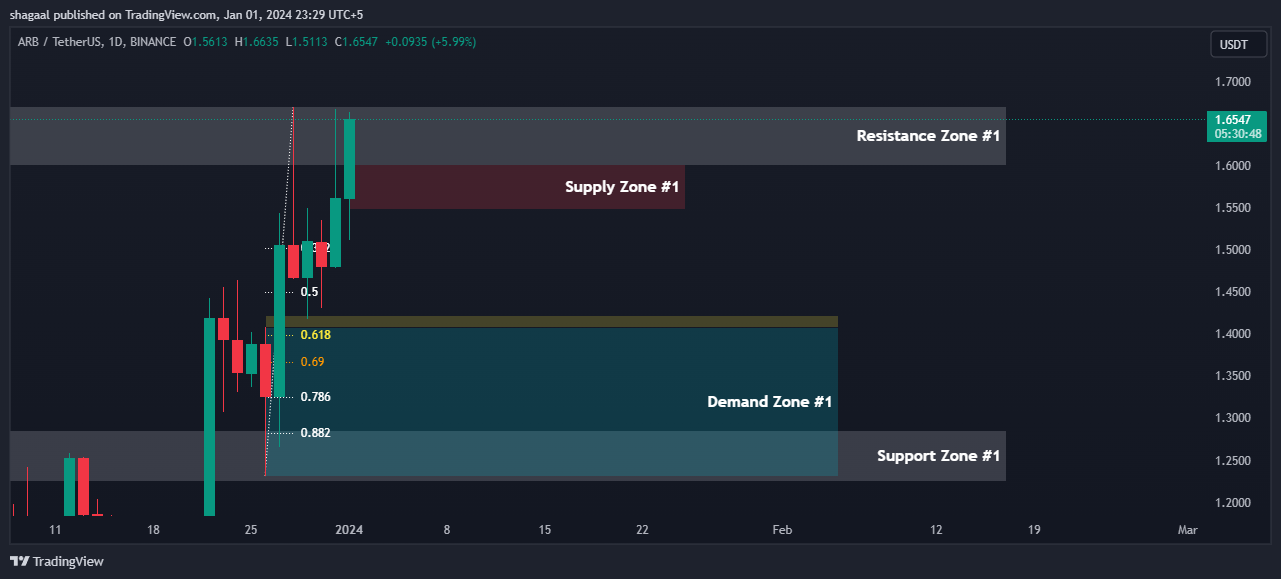
ARB USDT is finding support at 1.2246 and below at 0.9789. Resistance is found at 1.6000. Fibonacci retracement levels provide context for pullback levels. Supply zone #1 from 1.5691-1.6020 may stall further upside. Demand zone #1 from 1.4083-1.2310 is a large potential buying area. Bullish FVG #1 from 1.4083-1.4227 signals upside if price rallies into this gap.
Support and Resistance Levels
| Support Zone #1 | 1.2246 |
| Support Zone #2 | 0.9789 |
| Resistance Zone #1 | 1.6000 |
Fibonacci Retracement Levels
| 0.382 | 1.5014 |
| 0.50 | 1.4500 |
| 0.618 | 1.3987 |
| 0.786 | 1.3233 |
| 0.882 | 1.2829 |
Supply Zone
| Zone Number | High | Low |
| Supply Zone #1 | 1.5691 | 1.6020 |
Demand Zone
| Zone Number | High | Low |
| Demand Zone #1 | 1.4083 | 1.2310 |
Fair Value Gaps / Imbalances
| Gap Number | High | Low |
| Bullish FVG #1 | 1.4083 | 1.4227 |
4 Hour Timeframe

The 4 hour chart shows Fibonacci levels may indicate reversal/pullback areas. Demand zones #1 and #2 between 1.3967-1.3649 and 1.2660-1.3278 offer support if tested. Bullish FVGs between 1.4178-1.3967 and 1.3649-1.3123 suggest upside potential on a rise into these gaps.
Fibonacci Retracement Levels
| 0.382 | 1.5016 |
| 0.50 | 1.4500 |
| 0.618 | 1.3995 |
| 0.786 | 1.3250 |
| 0.882 | 1.2826 |
Demand Zone
| Zone Number | High | Low |
| Demand Zone #1 | 1.3967 | 1.3649 |
| Demand Zone #2 | 1.2660 | 1.3278 |
Fair Value Gaps / Imbalances
| Gap Number | High | Low |
| Bullish FVG #1 | 1.4178 | 1.3967 |
| Bullish FVG #2 | 1.3649 | 1.3123 |
1 Hour Timeframe

Support is seen at 1.4406 initially Fibonacci levels provide context for reversals. Supply zone #1 from 1.5691-1.6020 may halt further upside moves short-term. Demand zones #1-#3 between 1.5113-1.5042, 1.4926-1.4771, and 1.4317-1.4529 could attract buyers on declines. Bullish FVG #1 between 1.4780-1.4535 signals potential upside.
Support and Resistance Levels
| Support Zone #1 | 1.4406 |
Fibonacci Retracement Levels
| 0.382 | 1.5310 |
| 0.50 | 1.5117 |
| 0.618 | 1.4929 |
| 0.786 | 1.4659 |
| 0.882 | 1.4507 |
Supply Zone
| Zone Number | High | Low |
| Supply Zone #1 | 1.5691 | 1.6020 |
Demand Zone
| Zone Number | High | Low |
| Demand Zone #1 | 1.5113 | 1.5042 |
| Demand Zone #2 | 1.4926 | 1.4771 |
| Demand Zone #3 | 1.4317 | 1.4529 |
Fair Value Gaps / Imbalances
| Gap Number | High | Low |
| Bullish FVG #1 | 1.4780 | 1.4535 |