On the 1-hour scale I will be looking for a break above $1.7702 as confirmation of another leg higher within the 4-hour structures. Near-term upside targets are the resistance zone and 1-hour Fib extension levels up to $1.7464. Meanwhile, support is seen at $1.7292 and strong support below at $1.7192.
4 Hour Timeframe
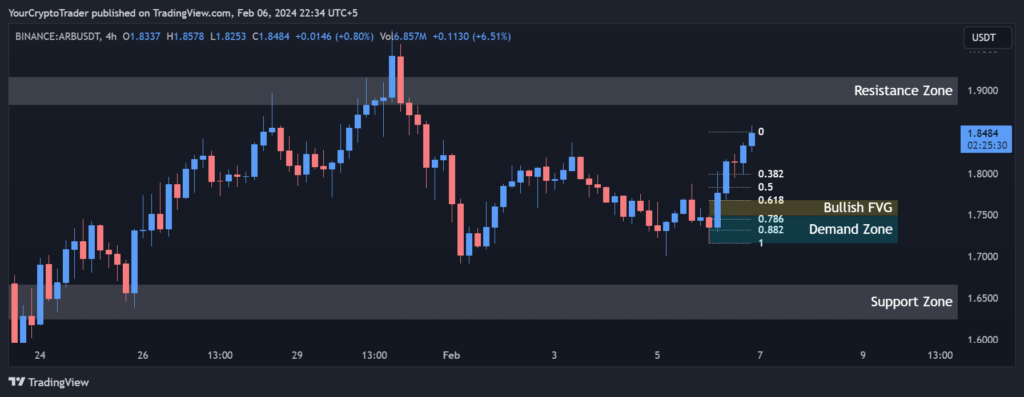
On the 4-hour chart, ARB USDT is currently trading within a resistance zone between $1.8822-1.9167. The price is finding resistance at the upper bound of this zone near $1.9167. Below this resistance zone sits a strong support zone between $1.6239-1.6666.
Looking at the Fibonacci retracement levels, the 0.382, 0.50 and 0.618 retracement levels line up closely between $1.7991-1.7675 and could provide resistance for any upward move from current prices. A break above the 0.618 level would target a move up to the 0.786 level at $1.7449.
There is an identified demand zone between $1.7490-1.7162 that could absorb selling pressure if prices were to pull back from resistance.
Additionally, we see a bullish fair value gap (FVG) between $1.7490-1.7680. Typically, bullish FVGs get filled by an increase in buying pressure, indicating potential upside.
Based on the combined confluence from these indicators, I would look for a break above $1.7675 as confirmation of a move higher targeting the resistance zone and 4-hour Fib extension levels up to $1.7449. Meanwhile, support lies at $1.7162 and below that the large support zone between $1.6239-1.6666.
Support and Resistance Levels
| S / R Type | High | Low |
| Support Zone | 1.6239 | 1.6666 |
| Resistance Zone | 1.8822 | 1.9167 |
Fibonacci Retracement Levels
| 0.382 | 1.7991 |
| 0.50 | 1.7833 |
| 0.618 | 1.7675 |
| 0.786 | 1.7449 |
| 0.882 | 1.7318 |
Demand Zone
| Zone Number | High | Low |
| Demand Zone | 1.7490 | 1.7162 |
Fair Value Gaps / Imbalances
| Gap Number | High | Low |
| Bullish FVG | 1.7490 | 1.7680 |
1 Hour Timeframe
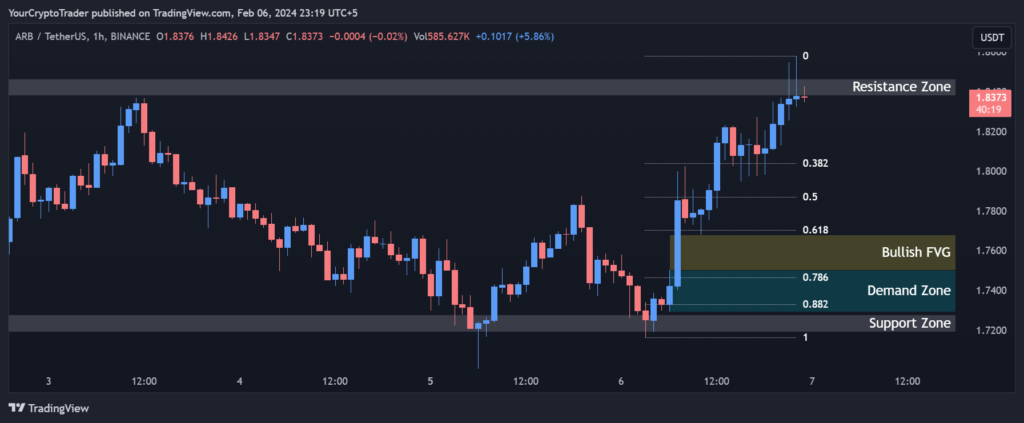
Zooming into the 1-hour chart, we can gain more clarity on potential shorter-term price moves. ARB USDT currently finds resistance near $1.8380 at the top of a resistance zone between $1.8464-1.8380. Below this, support is seen at $1.7192 within a support zone ranging from $1.7276-1.7192.
The 1-hour 0.382, 0.50 and 0.618 retracement levels fall closely between $1.8037-1.7702 and could provide resistance to any upside move in the short-term. A bullish break here would target a move up to the 0.786 level at $1.7464.
There is an identified demand zone on this timeframe between $1.7501-1.7292 that could absorb selling if we were to pull back short-term.
Also note the bullish fair value gap between $1.7680-1.7501 on the 1-hour chart. As mentioned, bullish FVGs tend to get filled with buying pressure.
Support and Resistance Levels
| S / R Type | High | Low |
| Support Zone | 1.7276 | 1.7192 |
| Resistance Zone | 1.8464 | 1.8380 |
Fibonacci Retracement Levels
| 0.382 | 1.8037 |
| 0.50 | 1.7870 |
| 0.618 | 1.7702 |
| 0.786 | 1.7464 |
| 0.882 | 1.7331 |
Demand Zone
| Zone Number | High | Low |
| Demand Zone | 1.7501 | 1.7292 |
Fair Value Gaps / Imbalances .
| Gap Number | High | Low |
| Bullish FVG | 1.7680 | 1.7501 |