Arbitrum ARB USDT is consolidating between support and resistance levels while respecting key Fibonacci retracements. As long as support holds on the shorter timeframes, the near term technical picture remains neutral to bullish for Arbitrum. Demand zones and fair value gaps highlight potential areas of interest for traders on further pullbacks or breaks of range boundaries.
4 Hour Timeframe
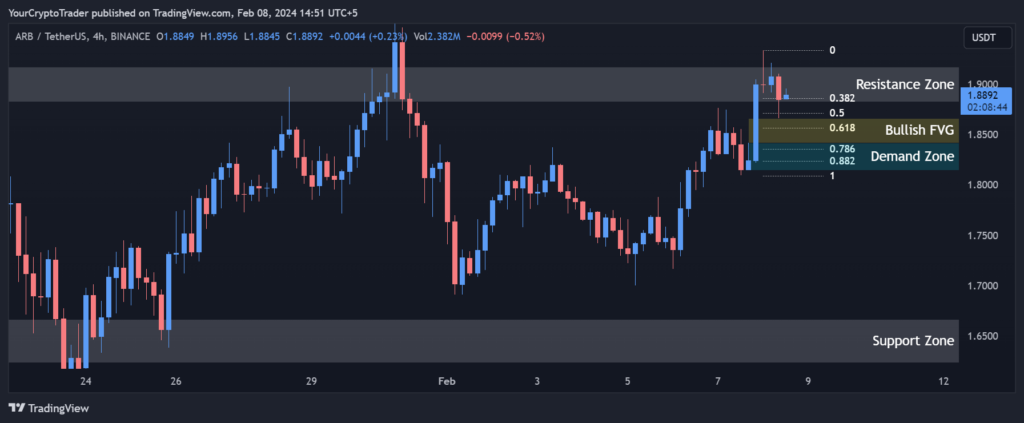
On the 4 hour chart for Arbitrum, we can see that price action remains within an overall range defined by support at 1.6239 – 1.6666 and resistance at 1.8822 – 1.9167. As long as this range holds, Arbitrum is consolidating within these boundaries.
Support and Resistance Levels
| S / R Type | High | Low |
| Support Zone | 1.6239 | 1.6666 |
| Resistance Zone | 1.8822 | 1.9167 |
Fibonacci Retracement Levels
Within the range, important Fibonacci retracement levels provide clues about potential areas of buying interest again. Levels at 1.8855, 1.8707, 1.8561 and 1.8351 act as resistance turned support.
| 0.382 | 1.8855 |
| 0.50 | 1.8707 |
| 0.618 | 1.8561 |
| 0.786 | 1.8351 |
| 0.882 | 1.8232 |
Demand Zone
The demand zone between 1.8418 – 1.8142 could attract buyers on a revisit to this area.
| Zone Number | High | Low |
| Demand Zone | 1.8418 | 1.8142 |
Fair Value Gaps / Imbalances
There is also a bullish fair value gap from 1.8418 – 1.8661 signaling potential upside momentum may emerge there.
| Gap Number | High | Low |
| Bullish FVG | 1.8418 | 1.8661 |
1 Hour Timeframe
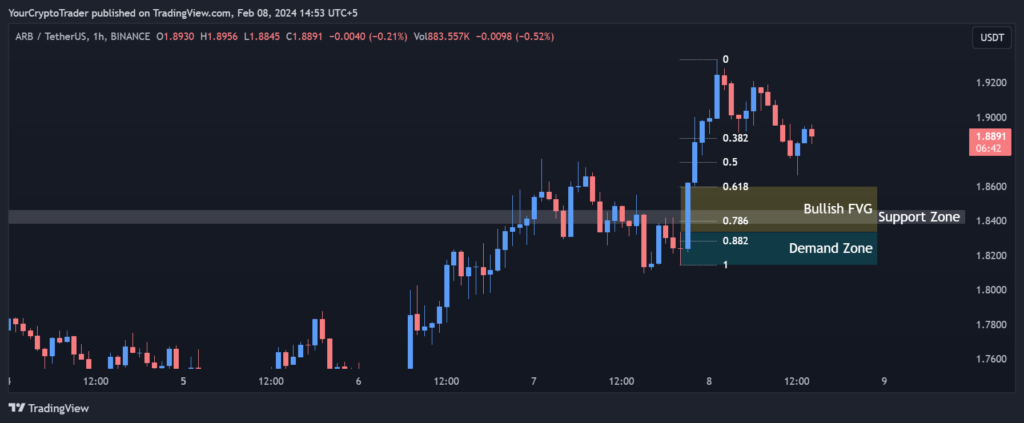
Zooming into the 1 hour chart, we can see support has formed at 1.8464 – 1.8380 just below the current price.
Support and Resistance Levels
| S / R Type | High | Low |
| Support Zone | 1.8464 | 1.8380 |
Fibonacci Retracement Levels
Key Fibonacci levels lying below at 1.8877, 1.8736, 1.8599 and 1.8397 become important for maintaining bullish structure short term.
| 0.382 | 1.8877 |
| 0.50 | 1.8736 |
| 0.618 | 1.8599 |
| 0.786 | 1.8397 |
| 0.882 | 1.8280 |
Demand Zone
The demand zone from 1.8336 – 1.8142 provides an area where bids may step in.
| Zone Number | High | Low |
| Demand Zone | 1.8336 | 1.8142 |
Fair Value Gaps / Imbalances
The bullish fair value gap ranging from 1.8601 – 1.8336 signals buying interest could surface within this window.
| Gap Number | High | Low |
| Bullish FVG | 1.8601 | 1.8336 |