Arbitrum ARB USDT presents a bullish technical bias above current support levels with upside potential towards resistance and targets at $2.11 and $2.17 respectively based on the confluence of indicators.
Supporting evidence exists from volume profile, moving averages and key Fibonacci levels. Near-term pullbacks present low-risk opportunities to enter long positions targeting gains of 5-10% over the coming days and weeks.
The current price of Arbitrum (ARB USDT) trading against the US Dollar Tether (USDT) on the hour chart is $2.0678. Let us take a closer look at the key support and resistance levels, Fibonacci retracement levels, volume profile levels, and moving averages to determine the short to medium term trade bias and potential areas of interest.
ARB USDT Technical Analysis
Support Levels
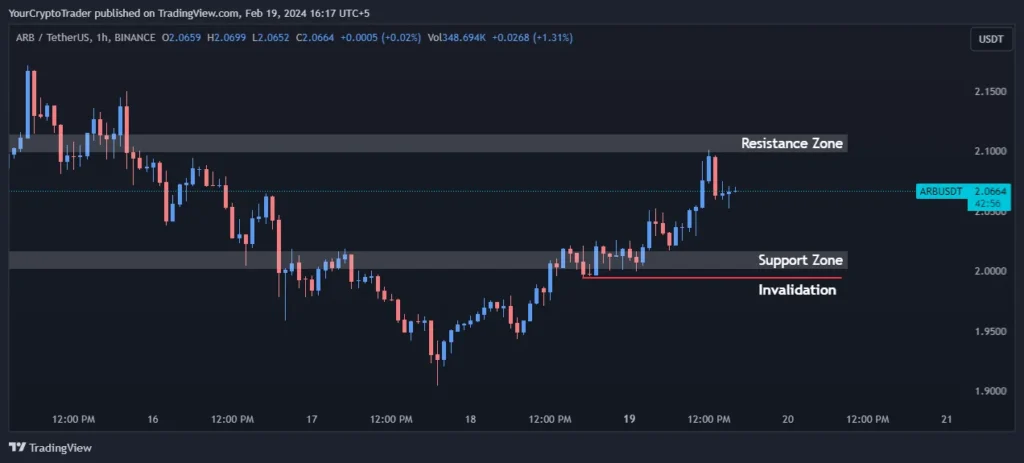
ARB USDT is finding immediate support at $2.0167 – $2.0014. This zone acted as resistance multiple times in late January and should now serve as a support floor if the price pulls back. Breaking below this level could see further weakness towards the next support at $1.93 – $1.9134.
| Support Zone Number | Price High | Price Low |
| Support Zone | 2.0167 | 2.0014 |
Resistance Levels
Resistance is encountered at $2.1144 – $2.0991. This area was previously tested as support and will now act as overhead pressure. A convincing break above here signals potential for a rally towards the next resistance zone of $2.1825 – $2.1634.
| Resistance Zone Number | Price High | Price Low |
| Resistance Zone | 2.1144 | 2.0991 |
Fibonacci Retracement Levels
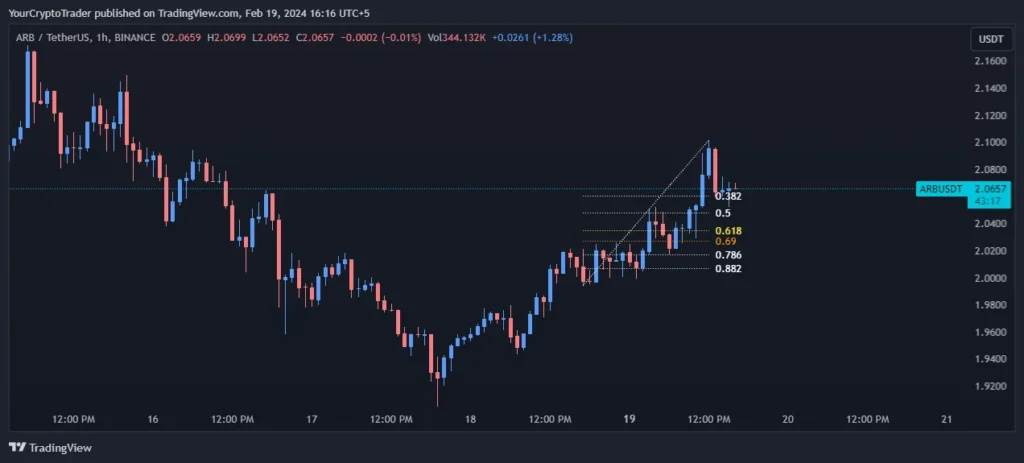
The recent swing high at $2.3478 to the swing low of $1.9052 has created a retracement to watch. Notable support levels exist at the 0.382 Fibonacci retracement level of $2.0602 and the 0.5 Fib level at $2.0477. A drop below $2.0348 (0.618 Fib) would signal more weakness is possible. Resistance lies at the 0.786 and 0.882 Fibonacci retracement levels of $2.0170 and $2.0066 respectively.
| Fib Retracement Value | Price |
| 0.382 Fib Level | 2.0602 |
| 0.50 Fib Level | 2.0477 |
| 0.618 Fib Level | 2.0348 |
| 0.786 Fib Level | 2.0170 |
| 0.882 Fib Level | 2.0066 |
Exponential Moving Averages (EMA) Levels
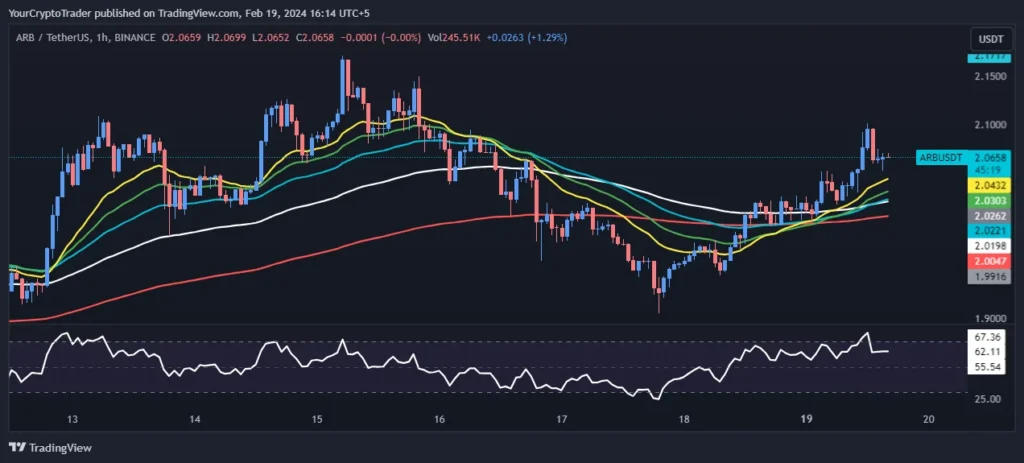
The 200 period EMA on the hourly chart currently sits at strong support of $2.0047. Holding above this level is encouraging for the bulls. Shorter term moving averages are in an upwards slope with the 55 EMA crossing above the 100 EMA – both positive signs. A pullback towards the 100 EMA at $2.0199 would present an opportune entry.
| EMA Type | EMA Price on Chart |
| 200 EMA (Red Color) | 2.0047 |
| 100 EMA (White Color) | 2.0199 |
| 55 EMA (Blue Color) | 2.0222 |
| 34 EMA (Green Color) | 2.0304 |
| 21 EMA (Yellow Color) | 2.0434 |
Fixed Range Volume Profile Levels
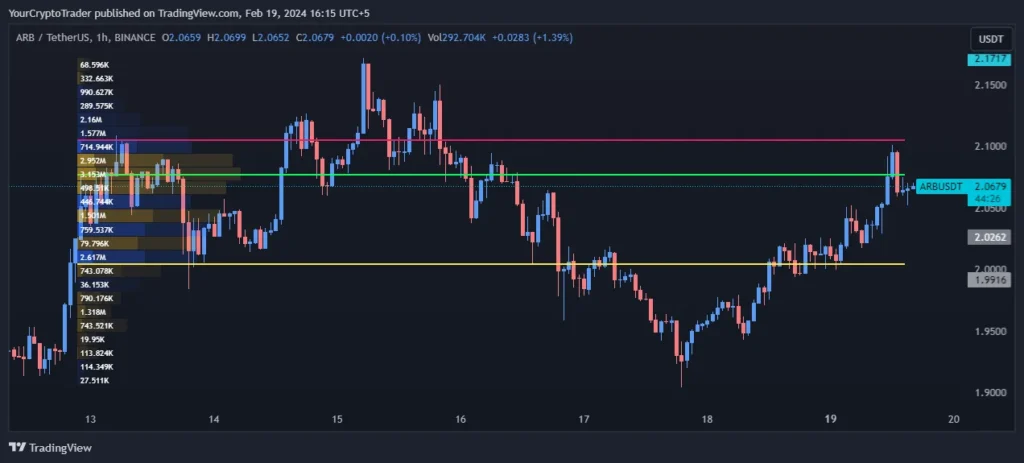
Volume analysis shows a point of control (area of highest volume traded) at $2.0773, signaling this zone could act as resistance on an up move. The current price sits safely above the lower bound of the value area at $2.0049 – further supporting the support analysis. Breaching above the value area high at $2.1056 would add confidence for a continuation of the current uptrend.
| Point of Control (POC) | Value Area High (VAH) | Value Area Low (VAL) |
| 2.0773 | 2.1056 | 2.0049 |
Relative Strength Index (RSI) Levels
The RSI oscillator on the hourly chart reads 64.73 indicating the market is not currently overbought, leaving room for potential further upside. An RSI dip below 50 would signal increasing selling pressure. For now, bullish momentum remains solid.
Current RSI Level: 64.73
Trade Bias
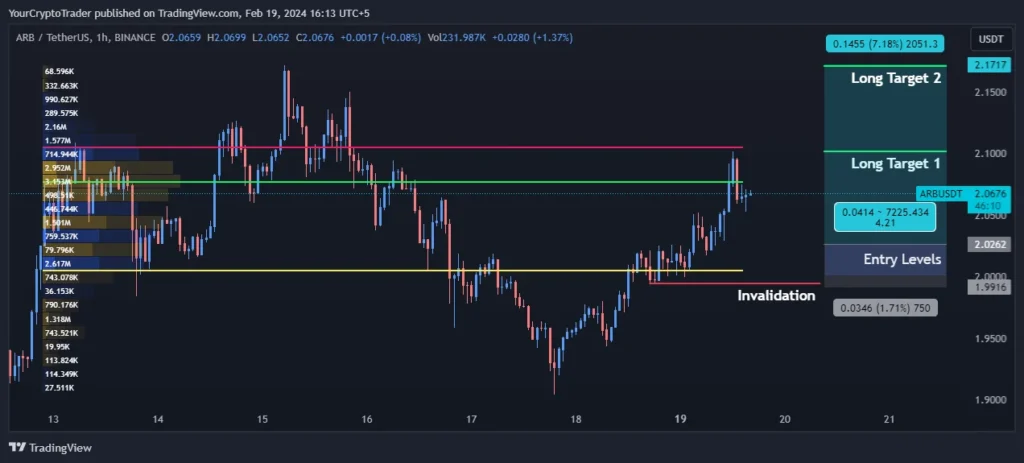
The technical indicators are leaning bullish on ARB. Immediate support exists at key Fibonacci levels and moving averages, pointing to upside potential if these floors hold. Attempts to push above resistance at $2.11 – $2.10 could trigger further buying pressure towards the first long target of $2.1022.
Trade Bias: Long
Entry Levels
| Entry Level Zone Number | Entry Level Price |
| Entry Levels 1 | 2.0005 |
| Entry Levels 2 | 2.0270 |
Invalidation Levels
Entry opportunities present themselves on dips towards support at $2.0005 or higher around the $2.0270 zone in line with the 55 EMA. The trade becomes invalidated below strong support at $1.9940, signaling the potential trend may have reversed to the downside.
| Invalidation Type (Long, Short) | Invalidation Price |
| Long | 1.9940 |
Target Levels
The first profit target is seen at $2.1022. Further buying interest above $2.11 could see momentum carry the price towards the psychological round number resistance of $2.1709. Traders may consider taking partial profits at each target and trailing stops to lock-in gains on additional upwards moves.
| Target Level | Target Price |
| Long Target 1 | 2.1022 |
| Long Target 2 | 2.1709 |