The current price of ARB USDT is 1.9537. The price is above all the Exponential Moving Averages (EMA) levels indicating an overall bullish trend in the longer term.
The technical analysis points to a bullish bias for ARB USDT with an opportunity for long positions on dips towards the demand zone.
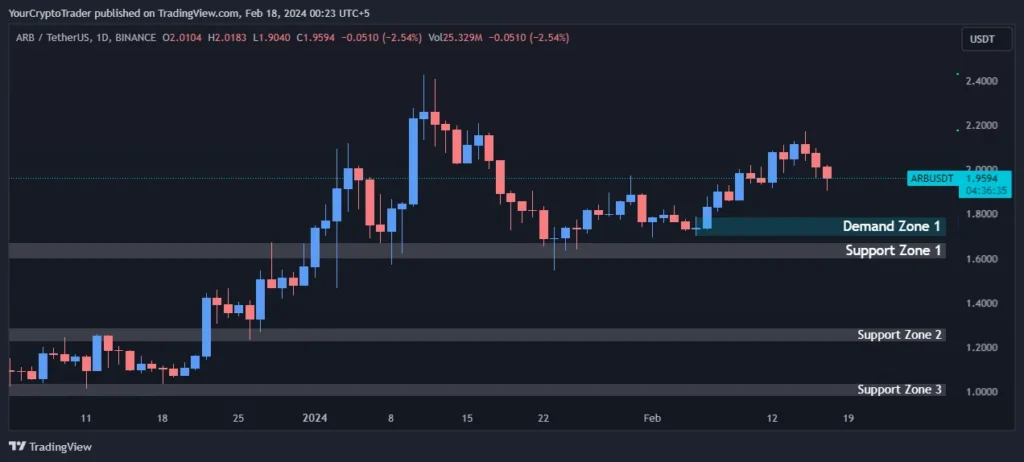
Support Levels
Strong support lies at support zone 1 between 1.6000-1.6709. Below this, support zone 2 between 1.2246-1.2861 acts as potential buying opportunities. Support zone 3 between 0.9789-1.0351 is the strongest support level.
| Support Zone Number | Price High | Price Low |
| Support Zone 1 | 1.6000 | 1.6709 |
| Support Zone 2 | 1.2246 | 1.2861 |
| Support Zone 3 | 0.9789 | 1.0351 |
Fibonacci Retracement Levels
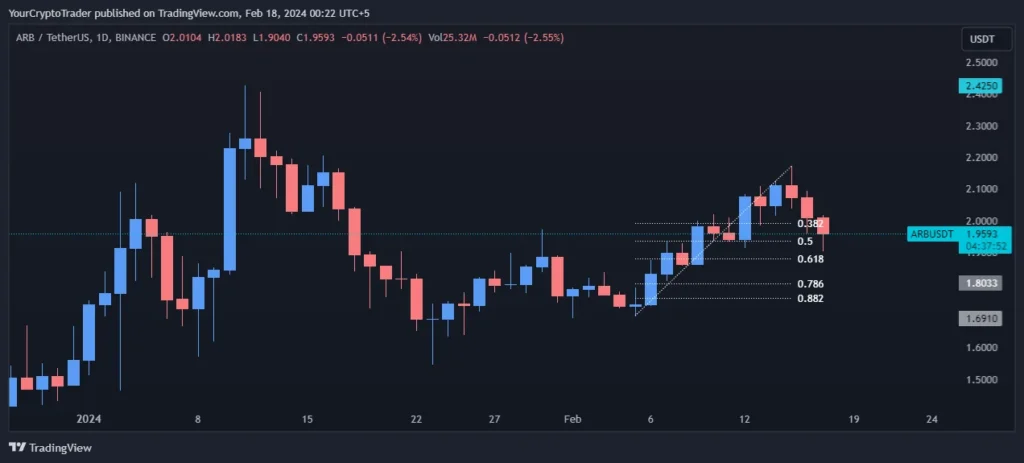
| Fib Retracement Value | Price |
| 0.382 Fib Level | 1.9913 |
| 0.50 Fib Level | 1.9256 |
| 0.618 Fib Level | 1.8807 |
| 0.786 Fib Level | 1.8012 |
| 0.882 Fib Level | 1.7565 |
Demand Zones
Demand zone 1 between 1.7876-1.7000 coincides with the 0.382, 0.50 and 0.618 Fib retracement levels of 1.9913, 1.9256 and 1.8807 respectively. This zone provides a high probability long entry area.
| Demand Zone Number | Price High | Price Low |
| Demand Zone 1 | 1.7876 | 1.7000 |
Exponential Moving Averages (EMA) Levels
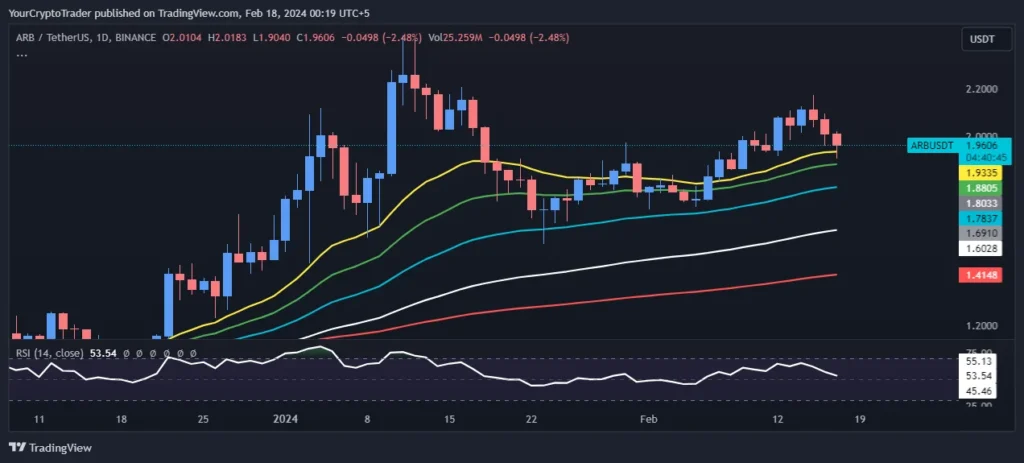
The 21 EMA at 1.9330 and 34 EMA at 1.8802 act as immediate support levels. 200 EMA at 1.4148 indicates long term bullish bias.
| EMA Type | EMA Price on Chart |
| 200 EMA (Red Color) | 1.4148 |
| 100 EMA (White Color) | 1.6027 |
| 55 EMA (Blue Color) | 1.7836 |
| 34 EMA (Green Color) | 1.8802 |
| 21 EMA (Yellow Color) | 1.9330 |
Fixed Range Volume Profile Levels
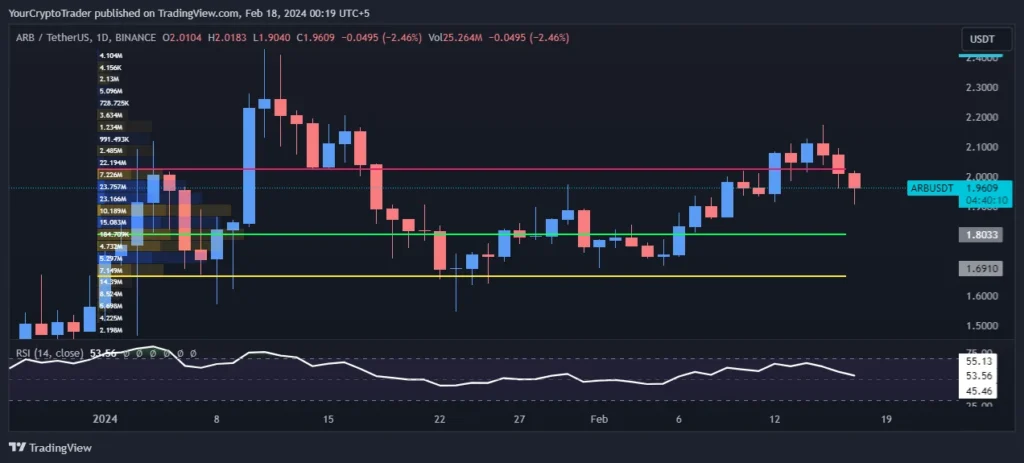
Point of Control (POC) of 1.8049 indicates the equilibrium price level with high volume activity. Value Area High (VAH) of 2.0242 and Value Area Low (VAL) of 1.6632 define the value zone.
| Point of Control (POC) | Value Area High (VAH) | Value Area Low (VAL) |
| 1.8049 | 2.0242 | 1.6632 |
Relative Strength Index (RSI) Levels
With the RSI at 53.40, it indicates neither an overbought or oversold situation providing room for upward movement.
Current RSI Level: 53.40
Trade Bias
Based on the technical factors, the trade bias is long as prices respect the demand zone and EMA support levels.
Trade Bias: Long
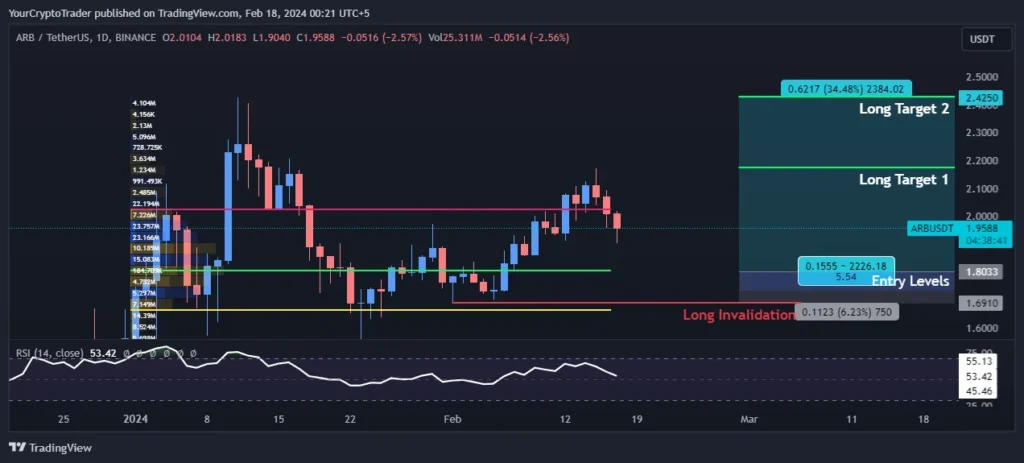
Entry Levels
Entry level 1 at 1.8033 and entry level 2 at 1.7320 can be considered. Invalidation is 1.6910. Upon breakout, first target is long target 1 at 2.1756 and then long target 2 at 2.4275.
| Entry Level Zone Number | Entry Level Price |
| Entry Levels 1 | 1.8033 |
| Entry Levels 2 | 1.7320 |
Invalidation Levels
| Invalidation Type (Long, Short) | Invalidation Price |
| Long | 1.6910 |
Target Levels
| Target Level | Target Price |
| Long Target 1 | 2.1756 |
| Long Target 2 | 2.4275 |