Avalanche AVAX USDT is currently trending downwards on the weekly charts. It needs to close above key resistance zones and fill supply/demand gaps on lower timeframes to confirm an upside reversal. Immediate support lies at identified demand zones and Fibonacci retracement levels.
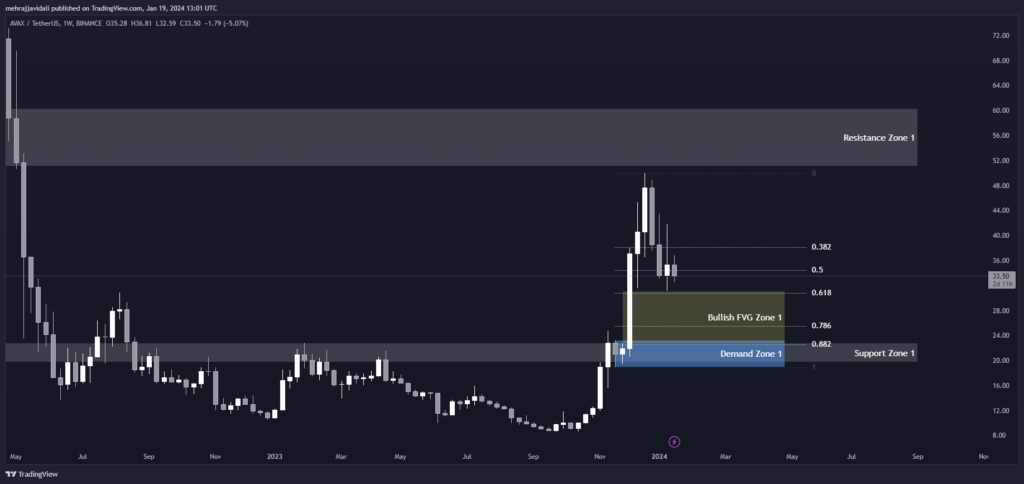
On the weekly timeframe, AVAX/USDT has formed a clear downtrend over the past 6 months, with lower highs and lower lows. The price is currently finding support at the Demand Zone 1 between $22.79-$19.65.
If this zone breaks, the next level of support lies at Demand Zone 2 between $23.25-18.90. However, the downward momentum seems to be slowing as indicated by the decreasing bearish volume.
On the upside, Avalanche needs to break above Resistance Zone 1 between $60.30-$51.04 to signify a trend reversal.
The 0.382, 0.50 and 0.618 Fibonacci retracement levels could provide resistance at $38.03, $34.39 and $30.75 respectively. A close above $51.04 on the weekly timeframe would be bullish.
Support and Resistance Levels
S / R Type
High
Low
Resistance Zone 1
60.30
51.04
Support Zone 1
22.79
19.65
Fibonacci Retracement Levels
0.382
38.03
0.50
34.39
0.618
30.75
0.786
25.62
0.882
22.48
Demand Zone
Zone Number
High
Low
Demand Zone 1
23.25
18.90
Fair Value Gaps / Imbalances
Gap Number
High
Low
Bullish FVG Zone 1
31.12
22.74
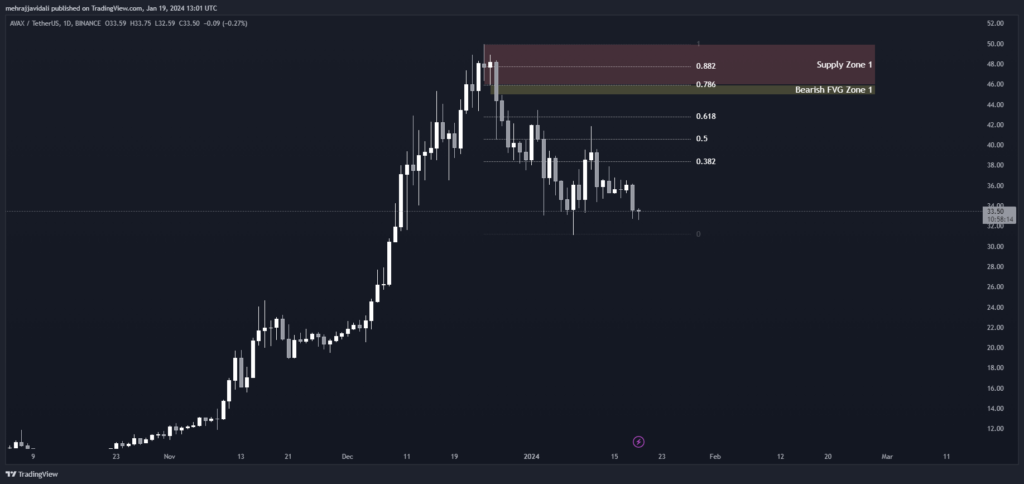
Daily Timeframe
Zooming into the daily chart, we can see AVAX/USDT is currently finding support at the 0.618 retracement level of $42.78. Below this, the next support lies at the 0.786 level of $45.94. There is a Bearish Fair Value Gap between $45.94-44.95 which needs to be filled.
Closing above Supply Zone 1 between $49.96-$45.94 would be the first sign of upside momentum.
On the upside, resistance lies at Supply Zone 1 and the 0.382, 0.50 Fibonacci retracement levels of $38.37 and $40.57 respectively. A sustained daily close above $51.04 is needed to confirm an upside breakout.
Fibonacci Retracement Levels
0.382
38.37
0.50
40.57
0.618
42.78
0.786
45.94
0.882
47.73
Supply Zone
Zone Number
High
Low
Supply Zone 1
49.96
45.94
Fair Value Gaps / Imbalances
Gap Number
High
Low
Bearish FVG Zone 1
45.94
44.95
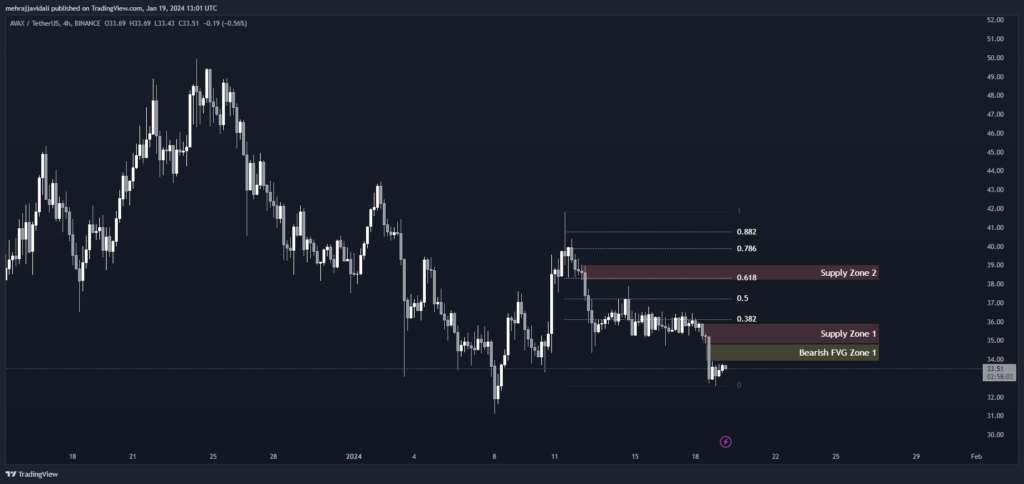
4 Hour Timeframe
In the 4 hour timeframe, AVAX USDT is currently trapped between Supply Zone 1 of $35.91-$34.82 and Supply Zone 2 of $39.02-38.20. It finds support at the 0.618 and 0.786 Fibonacci levels of $38.32 and $39.87. There is an unfilled Bearish Fair Value Gap between $34.82-33.91 adding to the downside pressure.
A break below $34.82 will target the 0.882 retracement level of $40.74. Meanwhile, a break above $39.02 is needed to shift momentum in favor of the bulls. Closing above Supply Zone 2 would be a confirmation of a short term trend reversal.
Fibonacci Retracement Levels
0.382
36.12
0.50
37.20
0.618
38.32
0.786
39.87
0.882
40.74
Supply Zone
Zone Number
High
Low
Supply Zone 1
35.91
34.82
Supply Zone 2
39.02
38.20
Fair Value Gaps / Imbalances
Gap Number
High
Low
Bearish FVG Zone 1
34.82
33.91
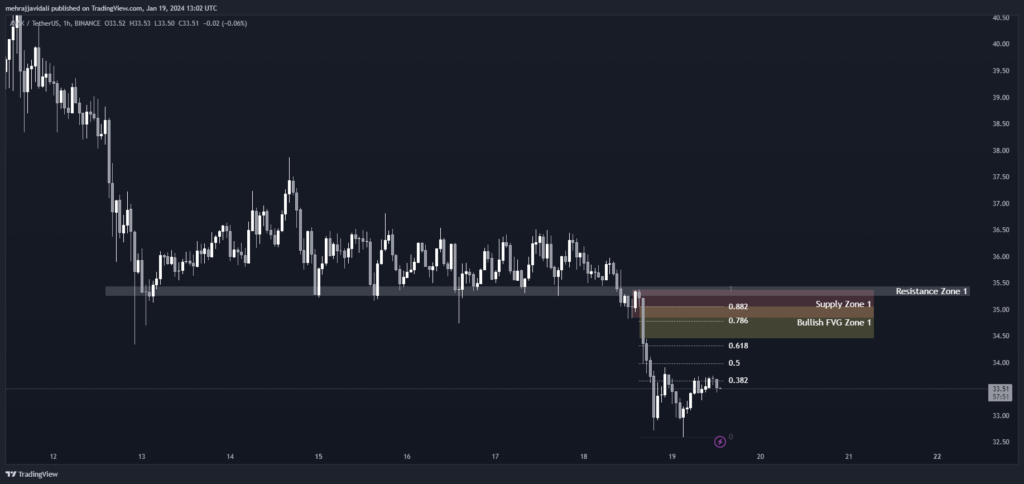
1 Hour Timeframe
In the 1 hour chart, AVAX USDT faces resistance at Supply Zone 1 of $35.38-$34.83. Below this, support is at $35.06 (0.882 Fibonacci) and $35.07-34.45 (Bullish Fair Value Gap). A sustained break below $35.06 targets the 0.618 and 0.50 Fibonacci levels of $34.32 and $33.99 respectively.
Meanwhile, a break above Supply Zone 1 and Resistance Zone 1 between $35.45-$35.24 could drive the price higher towards the 0.382 retracement level of $33.65. 1 hour closes above $35.45 would indicate upside momentum in the very short term.