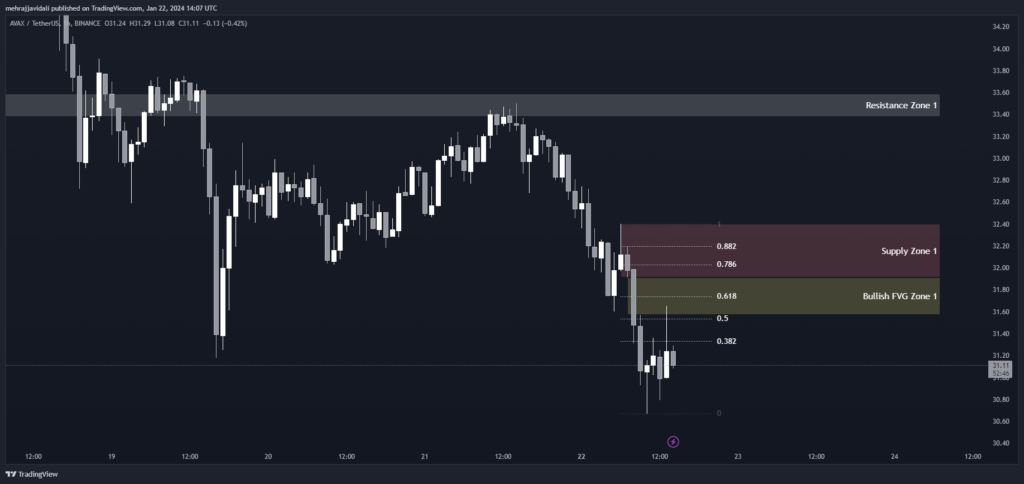
The current price of Avalanche (AVAX USDT) is 31.20 according to the data provided. To analyze the short term market structure and potential areas of support and resistance, I will be using Fibonacci retracement levels, supply zones, and fair value gaps from the 1 hour timeframe chart.
The key levels to watch for potential support and resistance on further upside or downside moves are the Fibonacci retracement levels, supply zone, and bullish FVG zone highlighted above on the 1 hour AVAX/USDT chart.
A break above the supply zone at 32.40 could lead to further buying pressure towards the next levels of resistance according to this technical analysis.
1 Hour Timeframe
Fibonacci Retracement Levels
Looking at the Fibonacci retracement levels, the first level of potential resistance lies at 31.33 (0.382 Fib Level). Further resistance levels exist at 31.53 (0.50 Fib Level), 31.74 (0.618 Fib Level), 32.03 (0.786 Fib Level) and 32.20 (0.882 Fib Level).
These Fibonacci retracement levels provide guidance on potential upside price targets as well as areas where sellers may step in.
| 0.382 | 31.33 |
| 0.50 | 31.53 |
| 0.618 | 31.74 |
| 0.786 | 32.03 |
| 0.882 | 32.20 |
Supply Zone
There is one supply zone identified between 32.40-31.91 according to the data. This zone would be a key area of potential resistance, as it indicates an area on the chart where sellers may have previously stepped in. A failure to break above this supply zone could result in a reversal back down.
| Zone Number | High | Low |
| Supply Zone 1 | 32.40 | 31.91 |
Fair Value Gaps / Imbalances
One bullish fair value gap (FVG) has been identified between 31.91-31.57 based on the gaps in market structure. This gap could potentially attract buyers if the price pulls back, providing initial support for any declines. FVG zones often act as magnets to pull the price back in.
| Gap Number | High | Low |
| Bullish FVG Zone 1 | 31.91 | 31.57 |