The 4 hour and 1 hour timeframes provide some interesting insights into the short to medium term price action and levels of support and resistance for AVAX USDT. Let’s break down the analysis.
4 Hour Timeframe
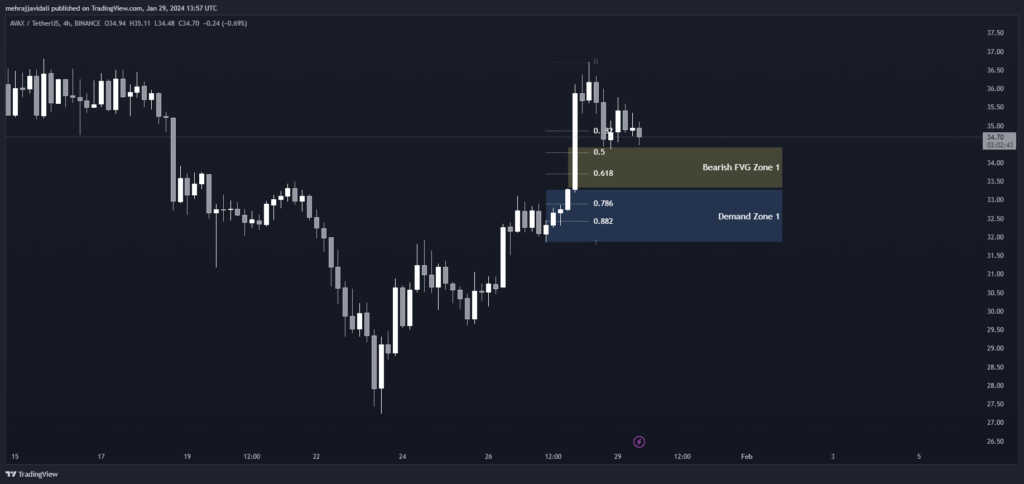
On the 4 hour chart of AVAX USDT, we can identify some key Fibonacci retracement levels that could act as support or resistance. The 0.382 level near 34.86, the 0.50 level at 34.28 and the 0.618 level around 33.70 will be important to watch.
Below this, the 0.786 and 0.882 levels at 32.90 and 32.43 respectively may prove to be resistant to further downside.
Additionally, there is a demand zone identified between 33.28-31.85 that could absorb selling pressure and potentially lead to a bounce if price revisits this area.
Above the current price, a bearish fair value gap exists from 34.43-33.32, which may now act as resistance.
Fibonacci Retracement Levels
| 0.382 | 34.86 |
| 0.50 | 34.28 |
| 0.618 | 33.70 |
| 0.786 | 32.90 |
| 0.882 | 32.43 |
Demand Zone
| Zone Number | High | Low |
| Demand Zone 1 | 33.28 | 31.85 |
Fair Value Gaps / Imbalances
| Gap Number | High | Low |
| Bearish FVG Zone 1 | 34.43 | 33.32 |
1 Hour Timeframe
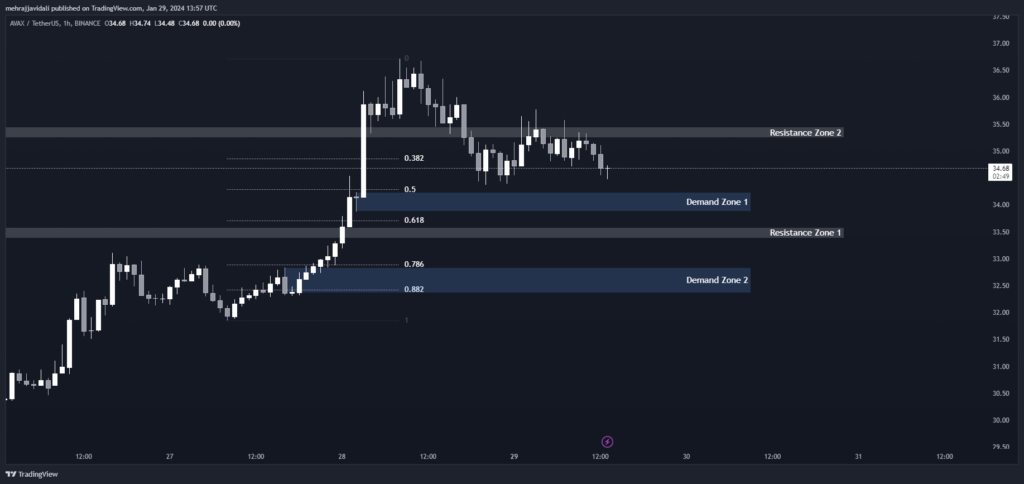
Zooming into the 1 hour chart, we can define more granular levels of support and resistance. The range between 33.59-33.38 may cap initial upside momentum. Above this, resistance strengthens from 35.45-35.24.
On the downside, demand zones exist at 34.24-33.87 and 32.84-32.36 that buyers may look to defend.
Fibonacci retracement levels on this timeframe closely mirror those of the 4 hour chart. Price stalling or reversing at any of these Fib levels would not be unexpected based on the significance traders place on these ratios.
Support and Resistance Levels
| S / R Type | High | Low |
| Resistance Zone 1 | 33.59 | 33.38 |
| Resistance Zone 2 | 35.45 | 35.24 |
Fibonacci Retracement Levels
| 0.382 | 34.86 |
| 0.50 | 34.28 |
| 0.618 | 33.73 |
| 0.786 | 32.91 |
| 0.882 | 32.43 |
Demand Zone
| Zone Number | High | Low |
| Demand Zone 1 | 34.24 | 33.87 |
| Demand Zone 2 | 32.84 | 32.36 |
In summary, with support defined on multiple timeframes, the current pullback could see buyers step in near the demand zones and Fibonacci supports.
However, breakouts above resistance at 35.45 or below 32.43 would signal a continuation of the prior trend and require a re-evaluation of positions.
Monitoring the defined levels of support and resistance will provide clues on the near-term price direction of AVAX USDT.