Bitcoin (BTC USDT) has been gradually moving upwards since January this year, breaking all of the resistances and making new highs. The last break happened at the start of this year which gave us a clear indication of further movement to the upside but unfortunately most of us were praying this should not be just another move up and fall down.
Bitcoin has been in the retracement phase to the downside since November and December 2022, and finally we are getting a good retracement to the upside.
Let’s dig deeper into the current price action of Bitcoin (BTC USDT) for clear indications on which side the price will go and when to get into the market. We will find opportunities to be sure where to take a Long or Short.
Bitcoin (BTC USDT) Weekly Timeframe
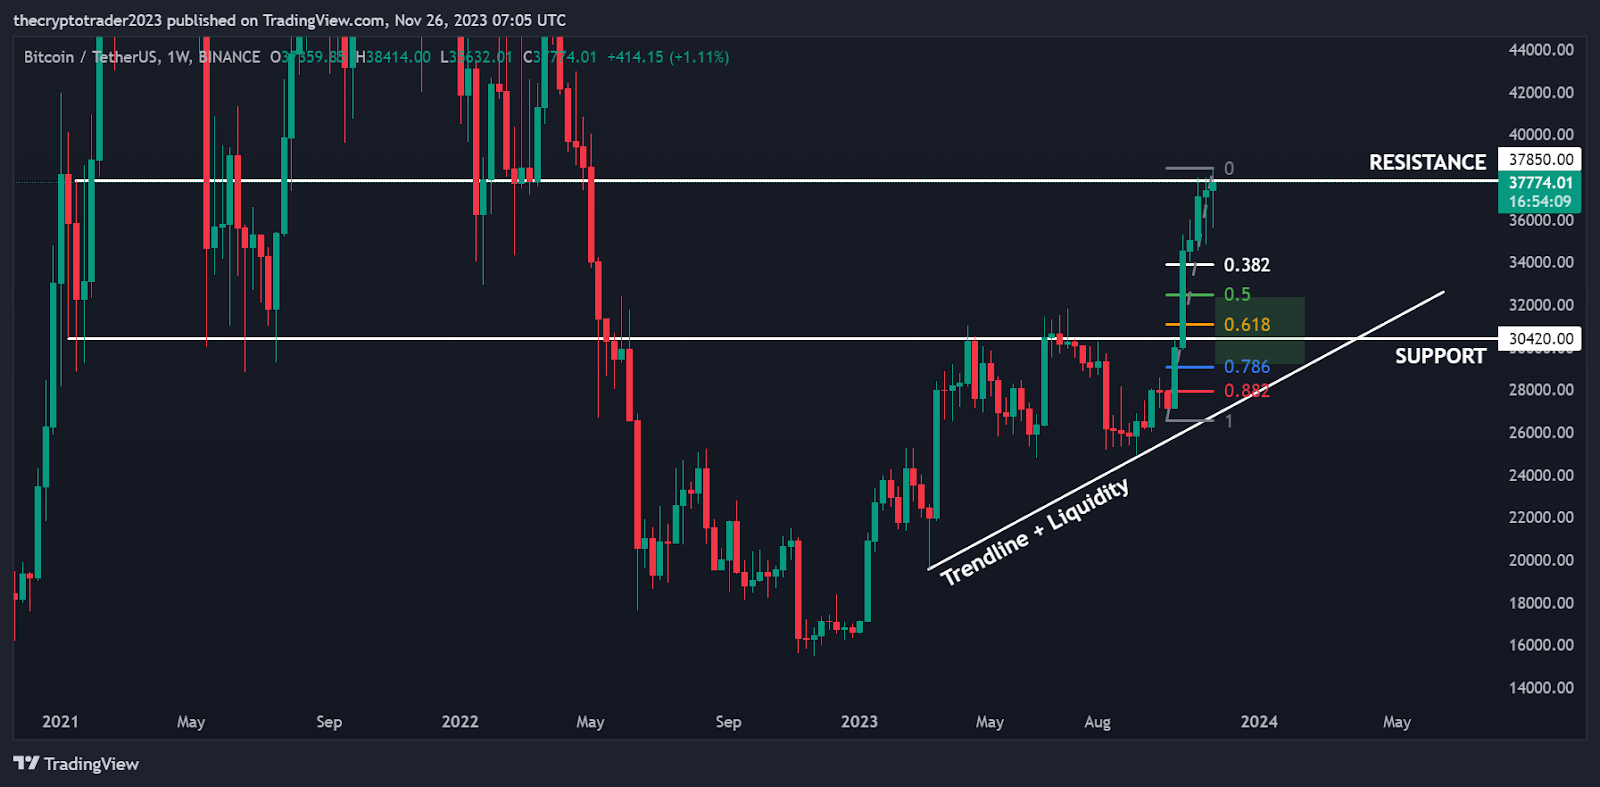
As you can see on the chart shown above, Bitcoin is currently at the weekly resistance which arises from the previous price action which was a good support for the Bitcoin. The price action on the chart for BTC USDT in this week and upcoming weeks is clear if we break the resistance and move upwards.
Current Resistance level for BTC USDT is 37850 and Support Level is 30420.
If the Price does not break the Resistance and tries to retrace downward for further liquidity grab and move higher, it is very common in price action of any coin, it has to grab most of the liquidity from the market to move higher or lower. So in the current situation of Bitcoin it has to break the resistance 37850 to make it sure it wants to go higher.
The Retracement levels for Bitcoin on the downside are 32500, 31000, 29000.

As shown on the above chart there is a good chance for BTC USDT on weekly timeframe to retrace downwards as there is a clear Fair Value Gap (FVG) which is also called imbalance or just gap. Price Action on any coin / token tries to fill the gaps so that there should not be any imbalances left in the price action.
Bitcoin (BTC USDT) Daily Timeframe

On daily timeframe BTC USDT is creating liquidity as you can see on the chart marked with a trendline (Trendline + Liquidity), this is a common pattern in price action when there is low or minimum liquidity for the price to go higher, it will try to grab those liquidity which is untapped.

In the above chart you can see the retracement levels fit on the weekly FVG and the weekly support as shown by the blue arrow. The levels are the same as mentioned above on the weekly timeframe which will be a good opportunity for us to grab some bitcoin to our wallets.
Bitcoin (BTC USDT) 4 Hour Timeframe

In the 4 Hour Timeframe we can clearly see a break of the last high which indicates that the price wants to go higher but since this break has happened in the weekend it is a bit sketchy and someone can not be sure about the price action. Mostly on weekends the price action of any coin / token tries to fool people on which side it wants to go.
But as a trader it is our job to identify the price action on the charts, so keep in mind if the Bitcoin breaks the new high which is created at 38414, then we can be sure about the price action to move higher. If it fails to do so then we already have our thesis weekly and daily that the Bitcoin is ready for a retracement to the downside.
I have marked the levels where the Bitcoin price might retrace with the price notes on the chart with the blue rectangles and red for the invalidation if the price breaks that then make sure you are not in the market and you should be focusing on the higher timeframe retracement levels, this will be just an indication for you that the higher timeframe retracement has started.
1 Hour Timeframe (Day Traders)

In the 1 hour timeframe which is mostly for day traders. In the above chart of BTC USDT 1 hour timeframe you can see the price action is in a range which means you can buy at the Range Lows and Sell at the Range Highs.
Ranges mostly form when there is not much liquidity in the market the price action will try to grab as much liquidity as possible from the Range Highs and Range Lows. Try to avoid getting in when it is in the middle and try to get in when it tries to break above or break low but fails to do so.

In the above chart i have shown you the price action, the price action is retracing to the range lows as discussed above and you two options if you want to get in the market, one at the mid range where the fibonacci retracement level 0.618 at 36680 and the second area at the range low, but wait for the break or touch to the range lows get back in the range than you can try to get a position. Do not just try to take position in any of the areas marked on the chart, be patient and wait for the right price action to develop.
I hope this technical analysis of BTC USDT added value to your trading ideas for this week and if you have any question please feel free to ask me anytime in the telegram channel. Happy Trading.