The daily and lower time frame charts of BTC USDT indicate that the current trend remains bearish. Traders should look for shorting opportunities on rallies towards overhead resistance zones or wait for a deeper pullback to demand zones to enter long positions.
Tight stops will be necessary as volatility is expected to remain elevated. It’s advisable to trade with the trend and manage risk carefully.
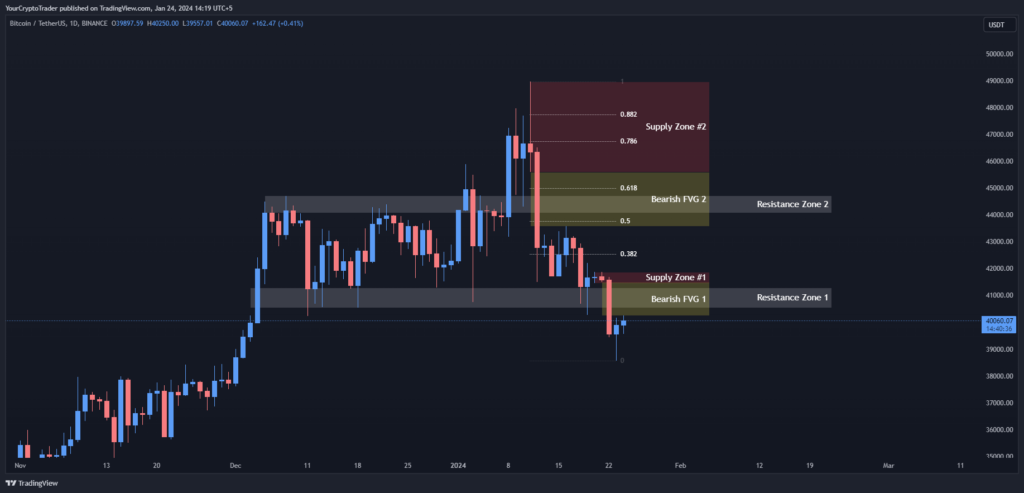
Daily Timeframe Analysis
In the daily timeframe, Bitcoin (BTC USDT) is currently in an overall downtrend, with prices trading below all key moving averages. The price is finding resistance at the lower level supply zone between $41,456 – $41,881, as well as the resistance zones between $40,543 – $41,300 and $44,073 – $44,731.
There also exist two bearish fair value gaps from $40,250 – $41,501 and $43,578 – $45,606 that will likely act as resistance going forward. On the downside, support lies at the 0.382 Fibonacci retracement level of $42,526 and the lower boundary of the descending channel near $40,000.
Support and Resistance Levels
S / R Type
High
Low
Resistance Zone 1
41300.00
40542.93
Resistance Zone 2
44731.10
44073.32
Fibonacci Retracement Levels
0.382
42526.00
0.50
43761.12
0.618
44996.24
0.786
46744.66
0.882
47755.21
Supply Zone
Zone Number
High
Low
Supply Zone #1
41881.39
41456.30
Supply Zone #2
48969.48
45606.06
Fair Value Gaps / Imbalances
Gap Number
High
Low
Bearish FVG 1
41500.98
40250.00
Bearish FVG 2
45606.06
43578.01
4 Hour (4H) Timeframe Analysis
Looking at the BTC USDT 4-hour chart, we can see prices are respecting the resistance zones identified on the daily chart. The price recently rejected from the $41,321 level after filling the bearish fair value gap. Short term momentum is declining as well.
This suggests the bears are still in control on this time frame. Support exists at the 0.382, 0.5 and 0.618 Fibonacci retracement levels between $39,947 – $40,806.
Support and Resistance Levels
S / R Type
High
Low
Resistance Zone 1
41144.87
40548.89
Resistance Zone 2
44488.00
44073.32
Fibonacci Retracement Levels
0.382
39946.90
0.50
40376.52
0.618
40806.14
0.786
41414.76
0.882
41763.83
Supply Zone
Zone Number
High
Low
Supply Zone 1
41881.39
41500.98
Fair Value Gaps / Imbalances
Gap Number
High
Low
Bearish FVG 1
41500.98
41321.17
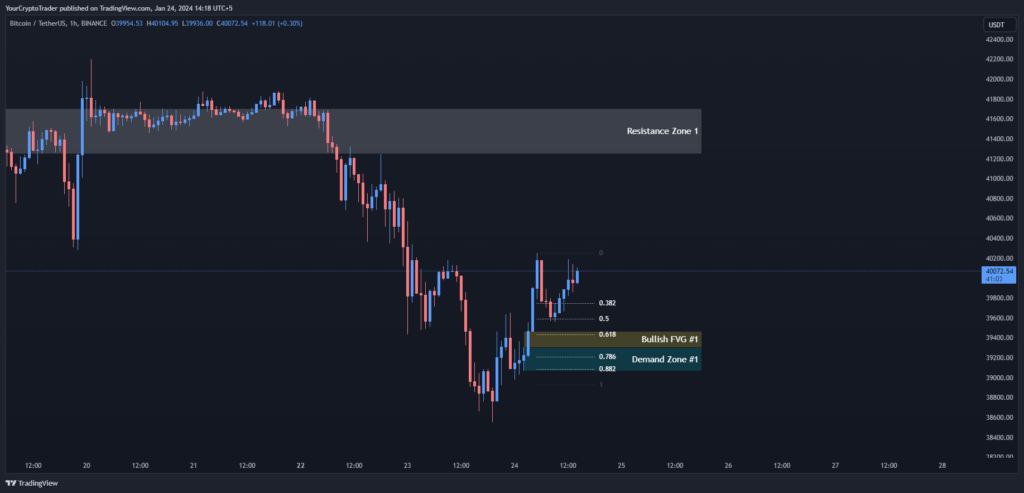
1 Hour (1H) Timeframe Analysis
On the 1-hour chart, Bitcoin (BTC USDT) found temporary support at the $39,303 – $39,070 demand zone. However, it was unable to sustain above the resistance zones and looks to be resuming its downward movement.
Momentum indicators like the MACD are also turning lower. There does exist a bullish fair value gap from $39,304 – $39,469, which if taken out, could signal a potential bounce. Below the $39,000 level, support flips to resistance as prices may drop further to tag the 0.382, 0.5 and 0.618 Fibonacci retracement levels.