BLUR USDT is currently trading within a daily demand zone and 4-hour support area. Resistance is seen at supply zones on lower timeframes and Fibonacci retracement levels on all timeframes.
A bounce off support could see a retest of supply zones, while a breakdown below could lead to a deeper pullback. Traders may look for range trading opportunities within the support and resistance structures.
Daily Timeframe
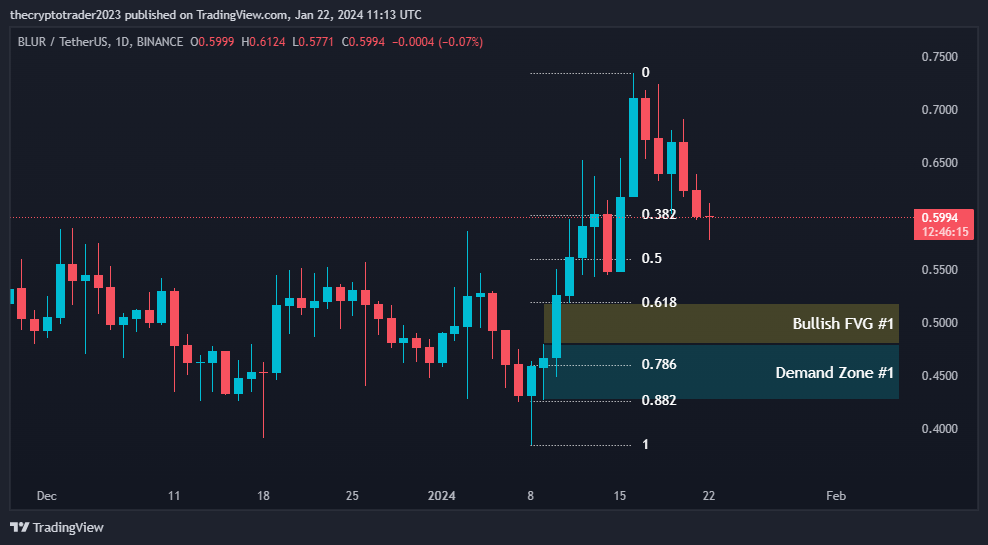
On the daily timeframe, we can see that BLUR USDT has pulled back after hitting resistance at the 0.6351 Fibonacci retracement level. Price action is now testing demand zone support between 0.4800-0.4268. This is a key support area on the daily chart.
If demand zone support holds, we may see a bounce back towards the 0.50 or 0.618 Fibonacci retracement levels near 0.5601 and 0.5189 respectively. However, a breakdown below the demand zone would be a bearish sign.
There is also a bullish fair value gap between 0.5186-0.4800 that may attract buying interest to fill this gap, providing support holds. On the upside, resistance lies at the 0.6351 Fibonacci level. Overall, the daily technicals are currently neutral with support and resistance levels in play.
Fibonacci Retracement Levels
| 0.382 | 0.6012 |
| 0.50 | 0.5601 |
| 0.618 | 0.5189 |
| 0.786 | 0.4597 |
| 0.882 | 0.4266 |
Demand Zone
| Zone Number | High | Low |
| Demand Zone #1 | 0.4800 | 0.4268 |
Fair Value Gaps / Imbalances
| Gap Number | High | Low |
| Bullish FVG #1 | 0.5186 | 0.4800 |
4 Hour Timeframe
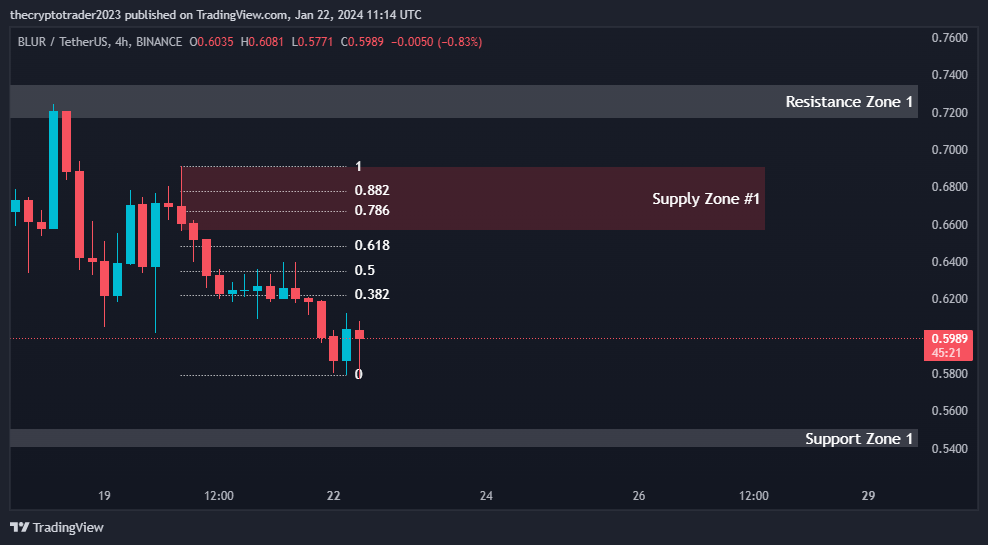
Zooming into the 4-hour chart, we can identify some key support and resistance levels that may provide trading opportunities. First support lies at 0.5509-0.5399, with strong resistance overhead at 0.7350-0.7165. Price action is currently trading within this range.
There is a supply zone between 0.6910-0.6564 that may act as resistance. A break above this zone could see price rise to fill the gap up to resistance. Alternatively, a break below 4-hour support may lead to a retest of the daily demand zone. Fibonacci retracement levels are also in consideration between 0.6220-0.6673.
Support and Resistance Levels
| S / R Type | High | Low |
| Support Level #1 | 0.5509 | 0.5399 |
| Resistance Level #1 | 0.7350 | 0.7165 |
Fibonacci Retracement Levels
| 0.382 | 0.6220 |
| 0.50 | 0.6351 |
| 0.618 | 0.6482 |
| 0.786 | 0.6673 |
| 0.882 | 0.6779 |
Supply Zone
| Zone Number | High | Low |
| Supply Zone #1 | 0.6910 | 0.6564 |
1 Hour Timeframe
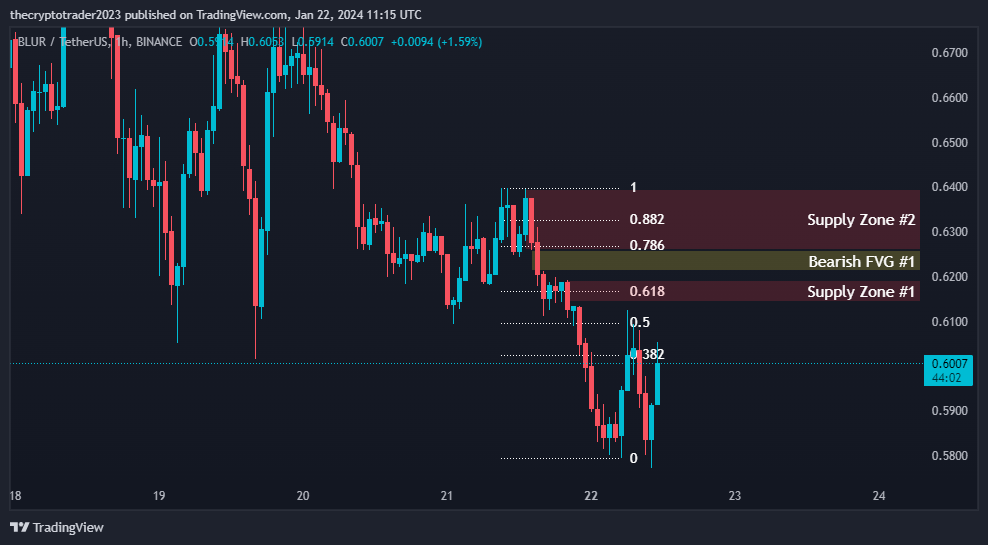
On the 1-hour chart, we can identify two supply zones overhead that may cap any advances. The lower supply zone is between 0.6193-0.6142, with stronger resistance expected from the 0.6396-0.6258 supply zone above.
There is also a bearish fair value gap from 0.6258-0.6211 that may attract sellers if reached. Below, support is found at the 0.50, 0.618 and 0.786 Fibonacci retracement levels between 0.6095-0.6268. A break below these levels could see price decline to retest the 4-hour support level.
Fibonacci Retracement Levels
| 0.382 | 0.6023 |
| 0.50 | 0.6095 |
| 0.618 | 0.6167 |
| 0.786 | 0.6268 |
| 0.882 | 0.6327 |
Supply Zone
| Zone Number | High | Low |
| Supply Zone #1 | 0.6193 | 0.6142 |
| Supply Zone #2 | 0.6396 | 0.6258 |
Fair Value Gaps / Imbalances
| Gap Number | High | Low |
| Bearish FVG #1 | 0.6258 | 0.6211 |