Bitcoin BTC USDT is finding support within the demand zone and is consolidating. On lower timeframes, downside support and upside resistance levels have been identified. A break above key resistance levels on increasing volume could indicate the next leg higher has begun. Conversely, a fall below strong support could signal further range-bound conditions. The technical indicators remain neutral in the near-term.
The current price of Bitcoin is $51,795.12 based on the BTC/USDT trading pair on major cryptocurrency exchanges. A technical analysis of Bitcoin across three timeframes, daily, 4-hour and 1-hour, can provide insight into potential near-term price movements.
Daily Timeframe
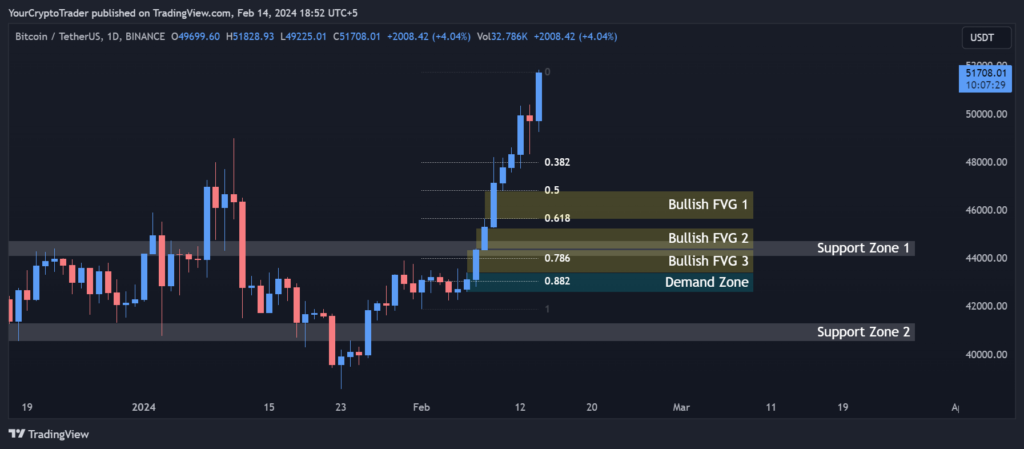
On the daily timeframe, Bitcoin BTC USDT is currently finding support in the demand zone between $43,399.98-$42,574. This demand zone has held as support during previous pullbacks. Below this, the next levels of support are the support zones between $44,073.32-$44,731.10 and $41,300-$40,542.93.
On the upside, the first level of resistance is the 0.382 Fibonacci retracement level at $47,975.12. Above this, resistance lies at the 0.50 Fib level of $46,809.61 and the supply zone between the 0.618 Fib level and fair value gap (FVG) 1 of $45,644.11 – $46,800. A break above these levels could see price rise to retest the all-time high around $69,000.
Support and Resistance Levels
S / R Type
High
Low
Support Zone 1
44073.32
44731.10
Support Zone 2
41300.00
40542.93
Fibonacci Retracement Levels
0.382
47975.12
0.50
46809.61
0.618
45644.11
0.786
43987.86
0.882
43074.27
Demand Zone
Zone Number
High
Low
Demand Zone
43399.98
42574.00
Fair Value Gaps / Imbalances
Gap Number
High
Low
Bullish FVG 1
45614.30
46800.00
Bullish FVG 2
44396.50
45242.12
Bullish FVG 3
43399.98
44331.10
4 Hour Timeframe
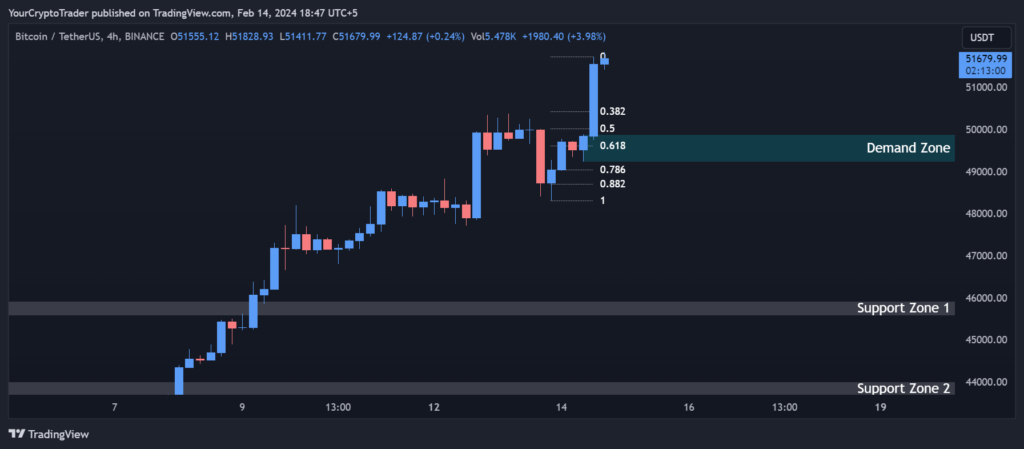
In the 4-hour chart, Bitcoin BTC USDT is consolidating within a symmetrical triangle pattern. Support is found at the 0.786 Fib level of $49,033.31 and the demand zone between $49,225.01-$49,877.22. Below here, further support lies at the support zones between $43,667.66-$44,006.43 and $41,420-$41,758.77.
Resistance is seen at the 0.382 Fib level of $50,415.04 and the 0.50 Fib level of $50012.92. A break above these levels could see the upward push continue towards testing resistance at the 0.618 Fib level of $49,607.73.
Support and Resistance Levels
S / R Type
High
Low
Support Zone 1
45918.90
45580.13
Support Zone 2
44006.43
43667.66
Support Zone 3
41758.77
41420.00
Fibonacci Retracement Levels
0.382
50415.04
0.50
50012.92
0.618
49607.73
0.786
49033.31
0.882
48702.18
Demand Zone
Zone Number
High
Low
Demand Zone
49877.22
49225.01
1HourTimeframe
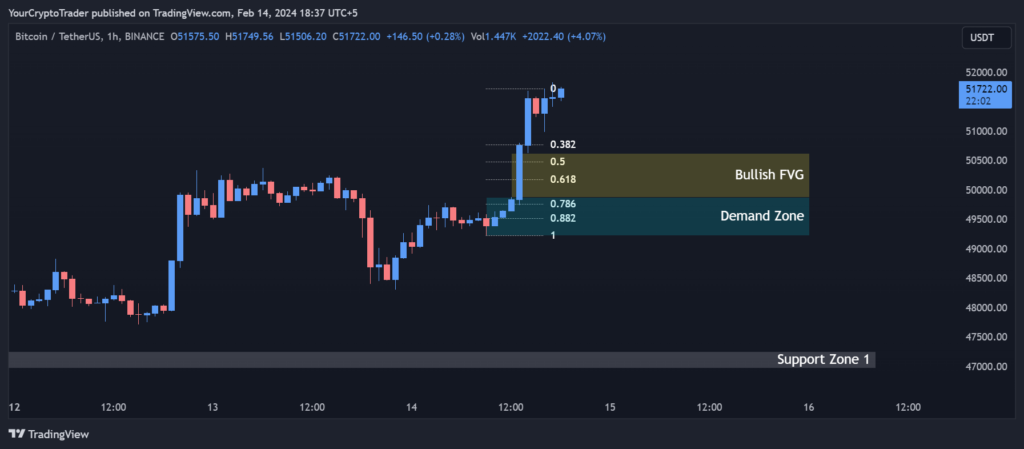
Zooming into the 1-hour chart, we can see Bitcoin is currently trading within the symmetrical triangle consolidation formed on the higher timeframes. Support is found at the demand zone mentioned earlier ($49,225.01-$49,877.22) as well as the support zones between $44,293.48-$44,600, $43,715.04-$43,787.35, $42,606.38-$42,720.33 and $41,251.64-$41,475.82.
The first level of resistance is seen at the 0.382 Fib level of $50,779.47. Above here, resistance is found at the 0.50 Fib level of $50,473.63 and the supply zone between the 0.618 Fib level and bullish FVG of $49,607.73 -$50,626.53. A break above could see price rise towards retesting the resistance levels observed on the 4-hour chart.