Bitcoin BTC USDT is consolidating within daily and 4-hour supply and demand zones after facing rejection from resistance levels.
Daily and 4-hour timeframe structure remains positive as long as support holds. A break above 44600 on hourly could signal bullish momentum pickup in the near term.
Daily Timeframe

- Bitcoin BTC USDT is currently trading within the Support Zone 1 of 41300-40542.93. Break below this zone could see further downward movement targeting the lower Fibonacci retracement levels of 0.618 and 0.786 at 40554 and 39673 respectively.
- On the upside, bulls need to push the price above the Resistance Zone 1 of 44073-44731 for an uptrend continuation. The 0.382 Fibonacci level of 41785 will act as intermediate resistance.
- Demand Zone 1 between 40300-39550 saw multiple bullish closes in the past and can attract buyers on further declines.
- Bullish Fair Value Gap between 40300-41394 provides support and incentive for buyers to defend this gap area.
Support and Resistance Levels
| S / R Type | High | Low |
| Support Zone 1 | 41300.00 | 40542.93 |
| Resistance Zone 1 | 44073.32 | 44731.10 |
Fibonacci Retracement Levels
| 0.382 | 41785.19 |
| 0.50 | 41169.67 |
| 0.618 | 40554.03 |
| 0.786 | 39673.03 |
| 0.882 | 39176.03 |
Demand Zone
| Zone Number | High | Low |
| Demand Zone #1 | 40300.24 | 39550.00 |
Fair Value Gaps / Imbalances
| Gap Number | High | Low |
| Bullish FVG #1 | 40300.24 | 41394.34 |
4 Hour Timeframe
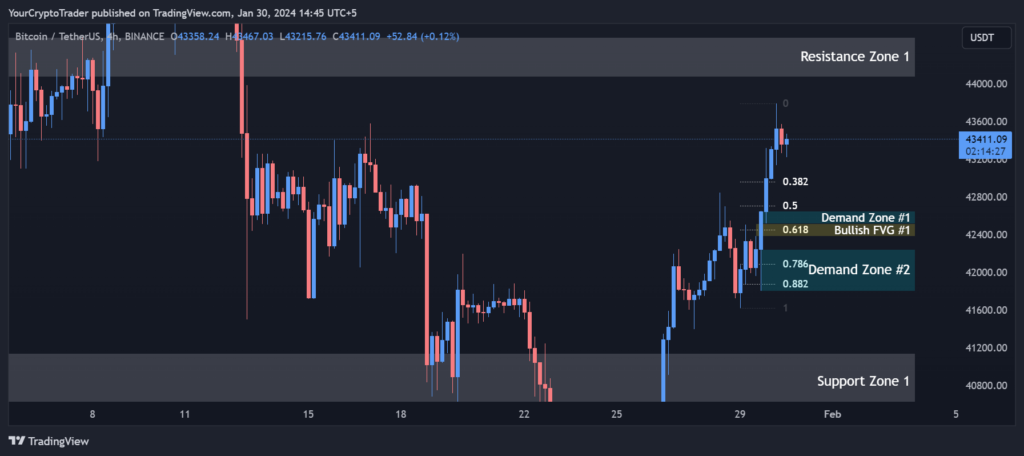
- The support of the Support Zone #1 41144-40548 is currently holding well. A breakdown could see a retest of Demand Zone 1 and Zone 2 between 42647-41804.
- Resistance Zone 1 of 44073-44488 is a tough nut to crack for bulls currently. Break above this could ignite momentum.
- Intraday movements are finding support at Fibonacci retracement levels indicating relief rallies have been played out from resistance flips to support.
- Bullish Fair Value Gap between 42381-42518 will act as a magnet on dips in the short term.
Support and Resistance Levels
| S / R Type | High | Low |
| Support Zone 1 | 41144.87 | 40548.89 |
| Resistance Zone 1 | 44073.32 | 44488.00 |
Fibonacci Retracement Levels
| 0.382 | 42960.38 |
| 0.50 | 42703.36 |
| 0.618 | 42449.42 |
| 0.786 | 42087.74 |
| 0.882 | 41878.41 |
Demand Zone
| Zone Number | High | Low |
| Demand Zone #1 | 42647.27 | 42518.00 |
| Demand Zone #2 | 42246.95 | 41804.88 |
Fair Value Gaps / Imbalances
| Gap Number | High | Low |
| Bullish FVG #1 | 42381.10 | 42518.00 |
1 Hour Timeframe
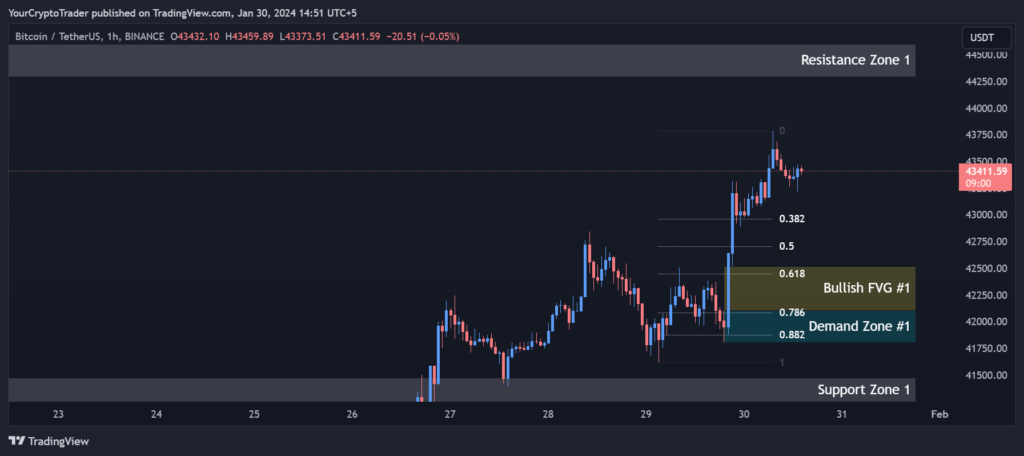
- Short term support is seen at 41475-41251 (Support Zone 1). Failure to hold could drag the price lower to test the Demand Zone 1 of 42104-41804.
- Resistance Zone 1 of 44600-44293 continues to cap upside moves. Decisive break above needed for bullish continuation.
- Current hourly movements respecting the 0.382-0.786 Fibonacci retracement fan. Indicates sideways consolidation.
- Bullish FVG between 42518-42104 likely to hold on temporary weakness given positive structure.
Support and Resistance Levels
| S / R Type | High | Low |
| Support Zone 1 | 41475.82 | 41251.64 |
| Resistance Zone 1 | 44600.00 | 44293.48 |
Fibonacci Retracement Levels
| 0.382 | 42960.73 |
| 0.50 | 42704.17 |
| 0.618 | 42447.60 |
| 0.786 | 42081.68 |
| 0.882 | 41879.36 |
Demand Zone
| Zone Number | High | Low |
| Demand Zone #1 | 42104.98 | 41804.88 |
Fair Value Gaps / Imbalances
| Gap Number | High | Low |
| Bullish FVG #1 | 42518.00 | 42104.98 |