The current Bitcoin BTC USDT market environment is forming an ideal setup for entering long positions. Support levels are clearly defined, and technical signals imply a near-term low may be developing. Strategic trade plans targeting resistance with prudent risk management position traders well for this opportunity.
1 Hour Timeframe
Technical Indicators
Examining short-term technical indicators on the hourly chart, the RSI and Stochastic oscillator are showing signs of bottoming after trending lower. Both dropped into oversold zones but are now attempting to turn higher, implying buying momentum may be returning. This coupled with reducing volume underscores the potential a short-term low is in place.
Longer term technicals on the daily chart also signal support for continued gains. Higher lows are being etched out while the 20-day exponential moving average holds as support. As long as this carries on, it maintains the primary uptrend remains intact.
Potential Trade Plan
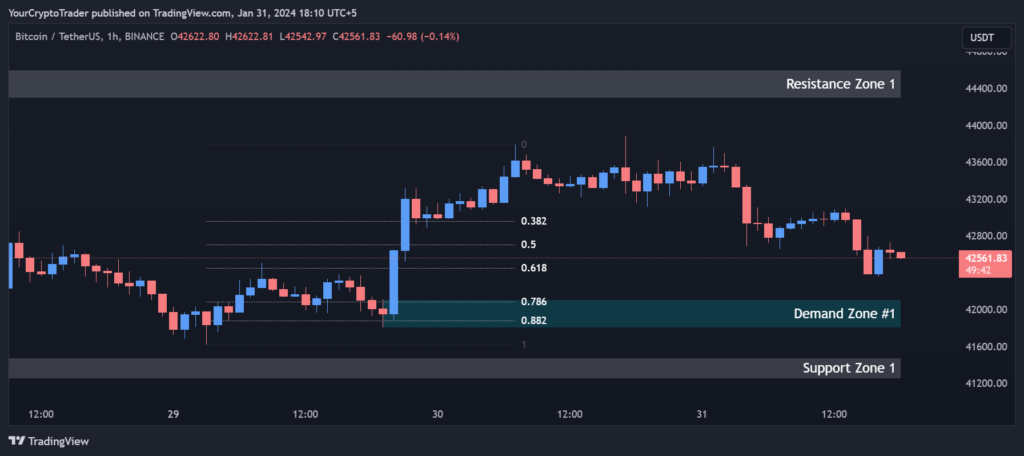
For traders scanning for entry opportunities, placing buy limit orders within Demand Zone 1 makes sense. This filters out random short-term fluctuations ensuring participation on a pullback to support. Alternatively, a break above the .50 Fibonacci level on increasing volume can prompt market entries.
Given starting conditions, targets for potential long trades could reasonably be the .618, .786, and Resistance Zone 1 levels. Taking partial profits at intervals hedges against unexpected pullbacks while allowing gains to compound. Stops tightly below Support Zone 1 mitigate downside risk.
Close monitoring of volume and momentum indicators will be key. Fading momentum could see one final flush into Demand Zone 1, whereas a volume spike portends continuation. Overall, risk is currently skewed to upside potential based on the confluence of factors reviewed. Patience and discipline will serve traders well waiting for high probability entries to form.
Support and Resistance Levels
The current price of Bitcoin BTC USDT is trading within the defined Support Zone 1 between 41475.82 and 41251.64. This indicates the cryptocurrency has seen some downward pressure over the past hour but buyers have managed to step in and defend this key support level for now. With resistance also facing headwinds above, this is creating a consolidation pattern that many traders will be analyzing for potential entry opportunities.
| S / R Type | High | Low |
| Support Zone 1 | 41475.82 | 41251.64 |
| Resistance Zone 1 | 44600.00 | 44293.48 |
| Resistance Zone 2 | 47248.99 | 46974.23 |
Fibonacci Retracement Levels
Looking closer at the provided Fibonacci retracement levels shows where recent selling pressure found acceptance. The current price sits precisely at the .50 retracement level of 42705.53, indicating sellers were able to push it down 50% from recent highs. This is a common retracement level where investors will look to enter long positions again on the assumption further downside is unlikely. Below this, support levels exist at .618 and within Demand Zone 1.
| 0.382 | 42959.79 |
| 0.50 | 42705.53 |
| 0.618 | 42451.14 |
| 0.786 | 42078.87 |
| 0.882 | 41880.32 |
Demand Zone
Demand Zone 1 from 42104.98 to 41804.88 establishes a lower risk area for entries. Its proximity to Support Zone 1 signals this area is highly significant. Placing stops just below protects against potential weakness breaking through. With resistance levels providing upside price targets, risk is balanced well against likely reward.
| Zone Number | High | Low |
| Demand Zone #1 | 42104.98 | 41804.88 |