Bitcoin (BTC USDT) faces resistance near 43787 USDT in the 1H and 44006-43667 USDT in the 4H. Downside appears limited as long as supports at 42606 USDT and 41758-41420 USDT remain intact. A daily close below 41758 USDT would turn the short term bias bearish.
4 Hour Timeframe
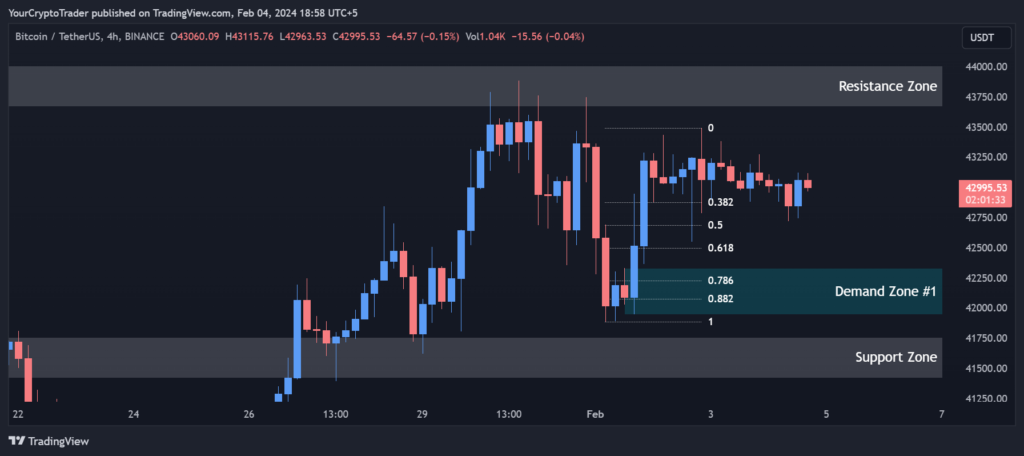
The 4H chart for BTC USDT shows the coin trading within a tight consolidation range over the past few days. On the upside, the immediate resistance zone is formed between 44006.43-43667.66 USDT. Breaking above this resistance could see prices test the next zone between 45000-46000 USDT.
Support and Resistance Levels
Strong support lies between 41758.77-41420 USDT. A daily close below this support level could result in further downside towards 41000-40500 USDT.
| S / R Type | High | Low |
| Support Zone 1 | 41758.77 | 41420.00 |
| Resistance Zone 1 | 44006.43 | 43667.66 |
Fibonacci Retracement Levels
The 0.382, 0.50 and 0.618 Fibonacci retracement levels provide additional upside resistance between 42874-42498 USDT. A failure to break above these levels may lead to another leg lower in the short term.
| 0.382 | 42874.38 |
| 0.50 | 42688.02 |
| 0.618 | 42498.84 |
| 0.786 | 42228.13 |
| 0.882 | 42074.36 |
Demand Zone
There is a demand zone between 42331-41944 USDT which could halt any downward move.
| Zone Number | High | Low |
| Demand Zone #1 | 42331.10 | 41944.89 |
1 Hour Timeframe
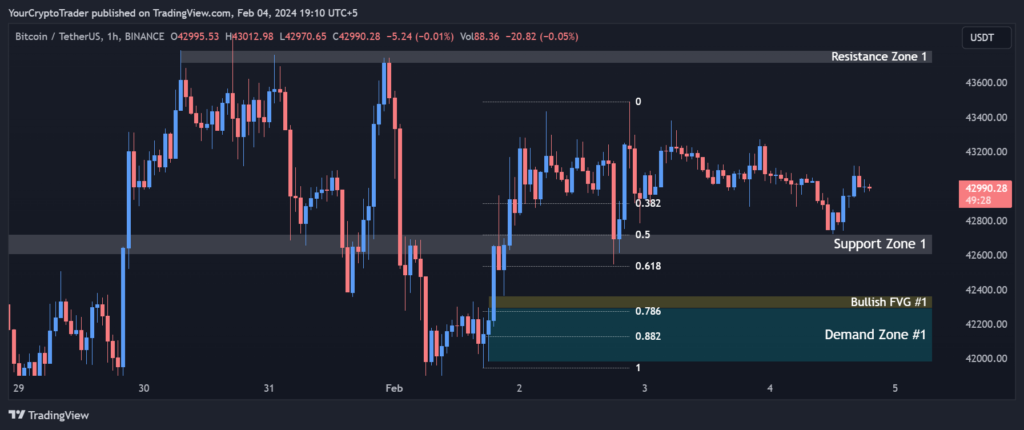
In the 1H timeframe, BTC USDT is currently trading between immediate support at 42606 USDT and resistance at 43787 USDT. Breaking below 42606 USDT could see it test the next support level between 41475-41251 USDT.
Support and Resistance Levels
Breaking above 43787 USDT resistance could open the path towards the 44600-44293 USDT resistance zone in the near term.
| S / R Type | High | Low |
| Support Zone 1 | 42720.33 | 42606.38 |
| Support Zone 2 | 41475.82 | 41251.64 |
| Resistance Zone 1 | 43787.35 | 43715.04 |
| Resistance Zone 2 | 44600.00 | 44293.48 |
Fibonacci Retracement Levels
The 0.382, 0.50 and 0.618 Fibonacci retracement levels lie between 42898-42535 USDT. These levels need to be surpassed for bullish momentum to continue.
| 0.382 | 42898.75 |
| 0.50 | 42716.16 |
| 0.618 | 42535.15 |
| 0.786 | 42275.31 |
| 0.882 | 42126.57 |
Demand Zone
There is also a demand zone between 42294-41981 USDT where buying interest is likely to emerge on further downside moves.
| Zone Number | High | Low |
| Demand Zone #1 | 42294.00 | 41981.17 |
Fair Value Gaps / Imbalances
A bullish fair value gap (FVG) exists between 42294-42364 USDT which increases the probability of prices retesting this zone in the short term.
| Gap Number | High | Low |
| Bullish FVG #1 | 42294.00 | 42364.00 |