The current setup remains bullishly biased as long as we hold above key support at $48,300.95. Look for bounce opportunities off supports, Fibs and demand zones to entries long positions. Keep stops tight below supports.
1 Hour Timeframe
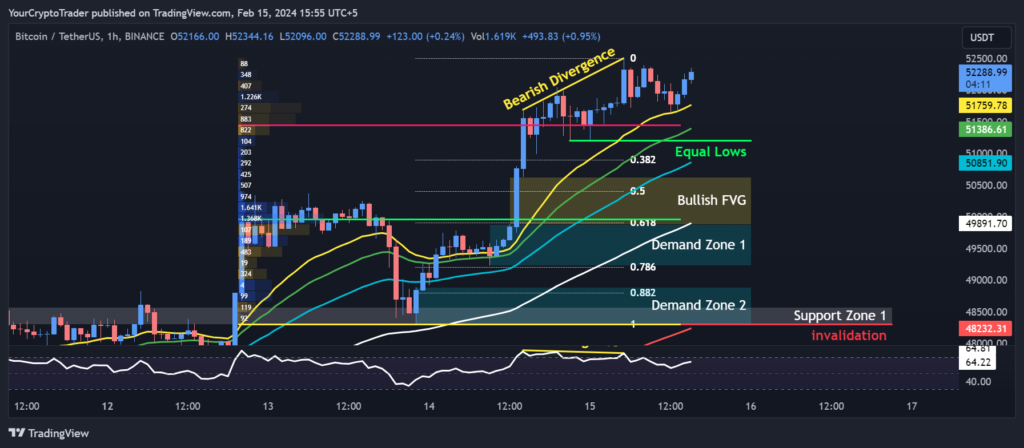
The price of BTC/USDT is currently trading at $52,262.78. It is currently in an overall bullish trend based on all the moving averages sloping upwards.
Support Levels
Support levels to watch that could lead to potential bounce or buying opportunities are $48,299.89, $46,974.23 and $44,293.48. Below $44,293.48 the trend may turn bearish.
| Support Zone Number | Price High | Price Low |
| Support Zone 1 | 48574.65 | 48299.89 |
| Support Zone 2 | 47248.99 | 46974.23 |
| Support Zone 3 | 44600.00 | 44293.48 |
Fibonacci Retracement Levels
Fibonacci retracement levels provide potential reversal areas between 0.382 – 0.886 Fib levels ($50,900.65 – $48,795). A bounce off these levels would be considered bullish.
| 0.382 Fib Level | 50900.65 |
| 0.50 Fib Level | 50408.76 |
| 0.618 Fib Level | 49907.45 |
| 0.786 Fib Level | 49205.87 |
| 0.882 Fib Level | 48794.98 |
Demand Zones
Demand zones between $49,225.01 – $48,300.95 could see an increase in buyers stepping in to support the price.
| Demand Zone Number | Price High | Price Low |
| Demand Zone 1 | 49877.22 | 49225.01 |
| Demand Zone 2 | 48888.88 | 48300.95 |
Fair Value Gaps / Imbalances (FVG)
There is an open bullish fair value gap between $49,877.22 – $50,626.53 that may attract buyers to fill this gap.
| FVG Zone Number | Price High | Price Low |
| Bullish FVG | 49877.22 | 50626.53 |
Exponential Moving Averages (EMA) Levels
The Point of Control on the volume profile at $49,965.82 is a significant liquidity level.
| 200 EMA (Red Color) | 48232.76 |
| 100 EMA (White Color) | 49891.08 |
| 55 EMA (Blue Color) | 50851.76 |
| 34 EMA (Green Color) | 51385.46 |
| 21 EMA (Yellow Color) | 51759.55 |
Liquidity Levels
A break below the invalidation level of $48,300.95 would imply the bullish thesis is invalidated.
| Liquidity Type (Double Top, Double Bottom, Equal Lows, Equal Highs) | Price |
| Equal Lows | 51200.24 |
Fixed Range Volume Profile Levels
The RSI is showing initial signs of bearish divergence at $51,686 suggesting downward momentum. However, it’s still within the bullish zone above 50.
| Point of Control (POC) | Value Area High (VAH) | Value Area Low (VAL) |
| 49965.82 | 51463.82 | 48290.76 |
Invalidation Levels
| Invalidation Type (Long, Short) | Invalidation Price |
| invalidation | 48300.95 |
Relative Strength Index (RSI) Levels
Current RSI Level: 64.75
Bullish or Bearish Divergences
Bearish Divergence: 51686.00