Bitcoin BTC USDT found acceptance above $52,500, upward momentum may continue towards $53,000 – $54,000. However, weakness under $51,300 could see a re-test of support between $48,300 – $49,877.
On balance, technical indicators paint a bearish picture, suggesting downside risks may be greater over the next 1-4 hours. Traders can look to short around $52,276 with stops above $52,816 and targets at $51,204, $49,916 and $48,298.
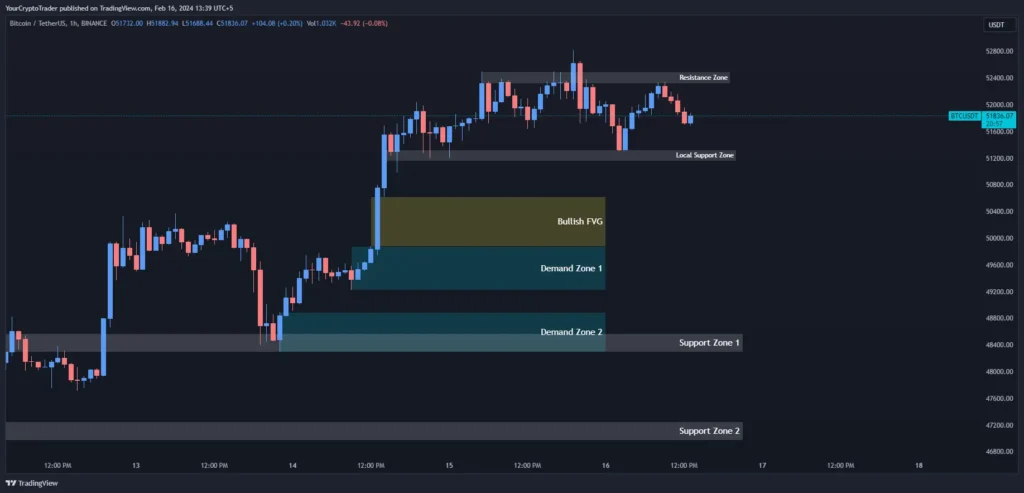
The current price of Bitcoin (BTC USDT) against the Tether stable coin (USDT) is $51,802.78 based on data from the 1-hour chart. Let’s take a closer look at some of the key support and resistance levels that could provide insight into the near-term market direction:
Bitcoin (BTC USDT) Technical Analysis
Support Levels
There are three identified support zones between $48,299 – $44,293 that could buoy the price if it corrects lower. Key support lies at $48,299 (Support Zone 1) with additional floors at $46,974 (Support Zone 2) and $44,293 (Support Zone 3).
| Support Zone Number | Price High | Price Low |
| Support Zone 1 | 48574.65 | 48299.89 |
| Support Zone 2 | 47248.99 | 46974.23 |
| Support Zone 3 | 44600.00 | 44293.48 |
Resistance Levels
Resistance is seen in the $52,500 zone as upside moves may face selling pressure in this region.
| Resistance Zone Number | Price High | Price Low |
| Resistance Zone | 52321.20 | 52500.00 |
Local Levels
| Local Support Zone Number | Price High | Price Low |
| Local Support Zone | 51327.27 | 51155.33 |
Fibonacci Retracement Levels
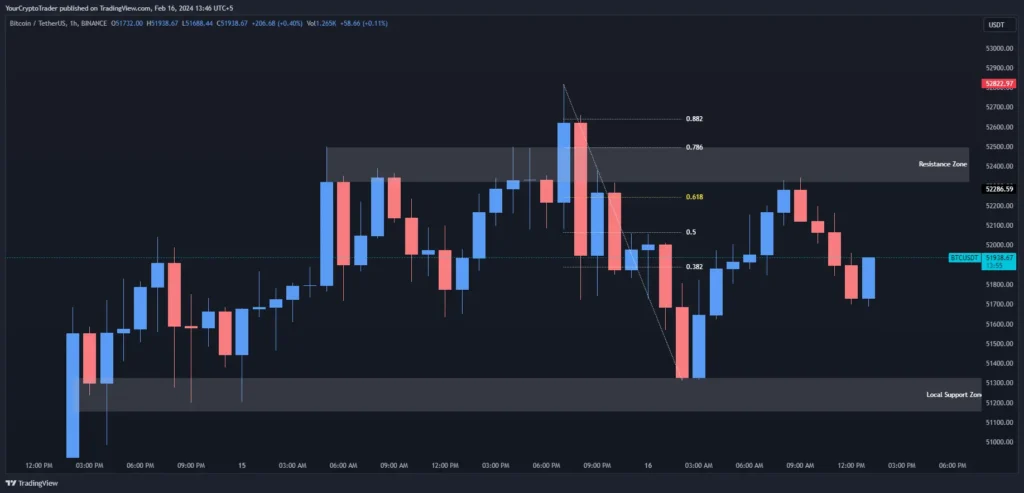
Pullbacks in the past have found support/resistance at standard Fib retracement levels of 0.382, 0.50, 0.618 and 0.786. To the upside, resistance spots include $51,886, $52,063, $52,243 and $52,494.
| Fib Retracement Value | Price |
| 0.382 Fib Level | 51886.76 |
| 0.50 Fib Level | 52063.94 |
| 0.618 Fib Level | 52243.63 |
| 0.786 Fib Level | 52494.62 |
| 0.882 Fib Level | 52639.87 |
Demand Zones
Prior support turned demand zones that may catalyze buying on a dip include $49,225 – $49,877 and $48,300 – $48,888 price areas.
| Demand Zone Number | Price High | Price Low |
| Demand Zone 1 | 49877.22 | 49225.01 |
| Demand Zone 2 | 48888.88 | 48300.95 |
Fair Value Gaps / Imbalances (FVG)
An unfilled bullish gap exists between $49,877 – $50,626 that market participants may look to fill, potentially providing fuel for an upward move.
| FVG Zone Number | Price High | Price Low |
| Bullish FVG | 49877.22 | 50626.53 |
Liquidity Levels
| Liquidity Type (Double Top, Double Bottom, Equal Lows, Equal Highs) | Price |
| Equal Lows | 51200.24 |
Fixed Range Volume Profile Levels

| Point of Control (POC) | Value Area High (VAH) | Value Area Low (VAL) |
| 51779.65 | 52821.06 | 49995.02 |
Relative Strength Index (RSI) Levels
The daily RSI is neutral at 49.31 but shows bearish divergences near $51,686, suggesting downside momentum may be building.
Current RSI Level: 49.31
Bullish or Bearish Divergences
Bearish Divergences: 51686.00
Trade Bias
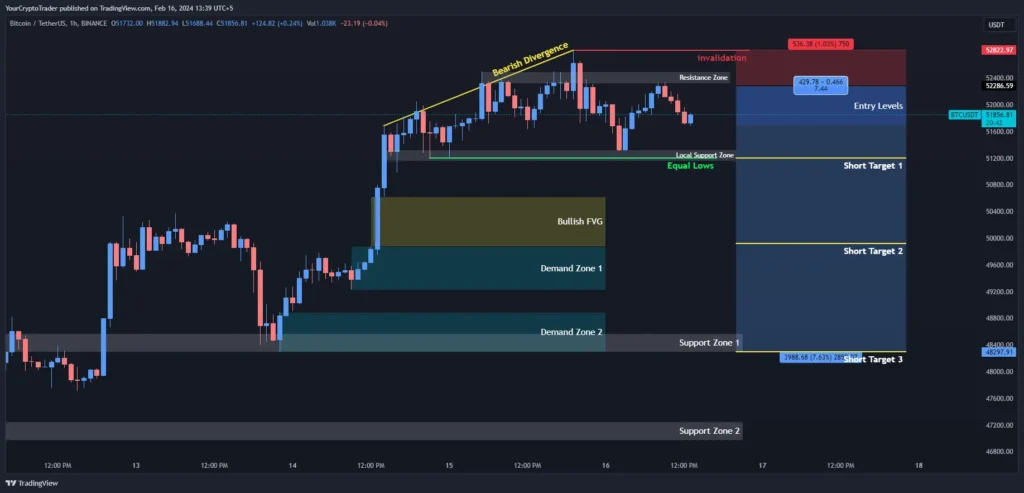
Given the bearish RSI divergences as well as support levels below, the near-term bias based on technicals is to the downside.
Trade Bias: Short
Entry Levels
| Entry Level Zone Number | Entry Level Price |
| Entry Levels | 52276.84 |
Invalidation Levels
| Invalidation Type (Long, Short) | Invalidation Price |
| Short | 52816.62 |
Target Levels
| Target Level | Target Price |
| Short Target 1 | 51204.09 |
| Short Target 2 | 49916.79 |
| Short Target 3 | 48297.91 |