BTC USDT as long as the invalidation level of $48,301 holds, the bullish structure remains intact. Look to buy dips towards support and demand zones. Take profits near resistance at Fibs/gaps. Reduce holdings slightly on breakdown of invalidation.
4 Hour Timeframe
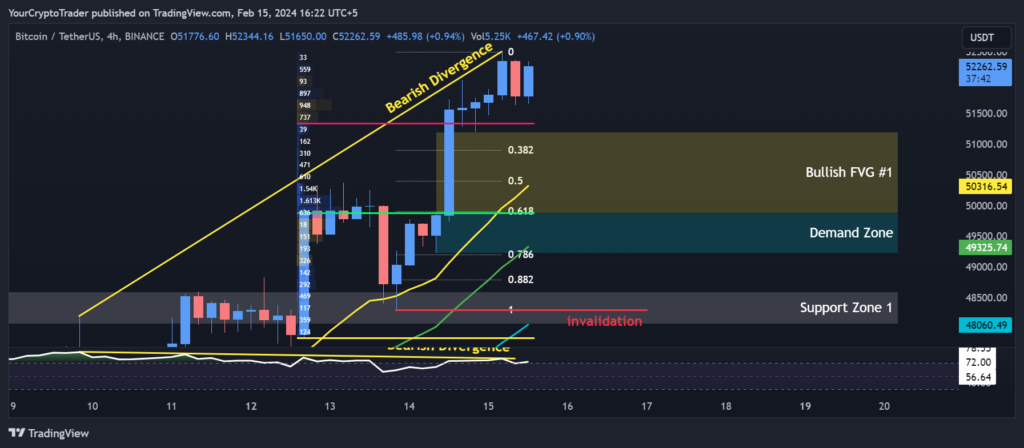
The price is currently trading above the key support zone between $48,081-$48,301, maintaining the overall bullish trend indicated by the moving averages.
Support Levels
Multiple zones of support exist down to $43,667, providing potential buying opportunities on any dips or pullbacks in this area.
| Support Zone Number | Price High | Price Low |
| Support Zone 1 | 48601.22 | 48081.08 |
| Support Zone 2 | 45918.90 | 45580.13 |
| Support Zone 3 | 44006.43 | 43667.66 |
| Support Zone 4 | 41758.77 | 41420.00 |
Fibonacci Retracement Levels
Fibonacci retracement levels between 0.382-0.886 Fib levels ($50,904 – $48,803) could serve as reversal areas back towards the upside.
| 0.382 Fib Level | 50904.55 |
| 0.50 Fib Level | 50400.56 |
| 0.618 Fib Level | 49907.65 |
| 0.786 Fib Level | 49199.34 |
| 0.882 Fib Level | 48803.31 |
Demand Zones
Demand zone between $49,225-$49,877 is a buyer concentration area that may halt any declines.
| Demand Zone Number | Price High | Price Low |
| Demand Zone | 49877.22 | 49225.01 |
Fair Value Gaps / Imbalances (FVG)
The bullish fair value gap from $49,877–$51,200 may attract buyers to fill this gap.
| FVG Zone Number | Price High | Price Low |
| Bullish FVG #1 | 49877.22 | 51200.24 |
Exponential Moving Averages (EMA) Levels
| 200 EMA (Red Color) | 44750.43 |
| 100 EMA (White Color) | 46366.65 |
| 55 EMA (Blue Color) | 48059.76 |
| 34 EMA (Green Color) | 49324.45 |
| 21 EMA (Yellow Color) | 50315.38 |
Fixed Range Volume Profile Levels
The point of control at $49,869-51,339 stacked with value areas signals key liquidity and potential for higher prices.
| Point of Control (POC) | Value Area High (VAH) | Value Area Low (VAL) |
| 49869.54 | 51338.76 | 47838.43 |
Invalidation Levels
| Invalidation Type (Long, Short) | Invalidation Price |
| invalidation | 48300.95 |
Relative Strength Index (RSI) Levels
RSI showing initial bearish divergence at $48,200 hints at building downward momentum, although still above the overbought threshold of 70.
Current RSI Level: 72.15
Bullish or Bearish Divergences
Bearish Divergence: 48200.00