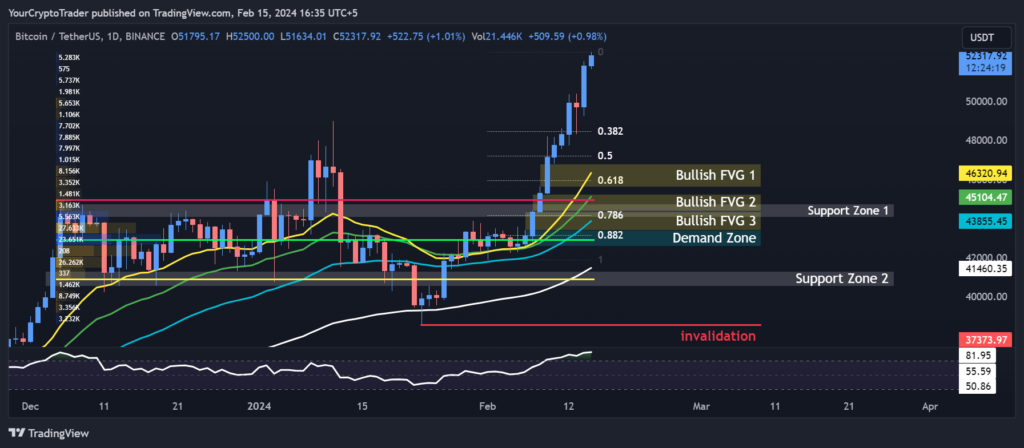
BTC USDT with robust daily support zones and gaps/moving averages maintaining an uptrend, the bullish bias is intact. Look to take profits near resistance while dollar cost averaging on healthy dips towards demand. Reduce risk around invalidation.
Daily Timeframe
Support Levels
The price is currently well above the key support zones between $40,542-$44,731 providing stronger support.
| Support Zone Number | Price High | Price Low |
| Support Zone 1 | 44073.32 | 44731.10 |
| Support Zone 2 | 41300.00 | 40542.93 |
Fibonacci Retracement Levels
Multiple Fibs between 0.382-0.882 provide potential reversal areas if the price were to retrace from current levels.
| 0.382 Fib Level | 48452.43 |
| 0.50 Fib Level | 47186.43 |
| 0.618 Fib Level | 45973.54 |
| 0.786 Fib Level | 44153.78 |
| 0.882 Fib Level | 43151.65 |
Demand Zones
Demand zone between $42,574-$43,400 could halt any price decline in the near term.
| Demand Zone Number | Price High | Price Low |
| Demand Zone | 43399.98 | 42574.00 |
Fair Value Gaps / Imbalances (FVG)
Several bullish fair value gaps exist from $43,396- $46,800 that may attract further buying pressure to drive the price higher to fill these gaps.
| FVG Zone Number | Price High | Price Low |
| Bullish FVG 1 | 45614.30 | 46800.00 |
| Bullish FVG 2 | 44396.50 | 45242.12 |
| Bullish FVG 3 | 43399.98 | 44331.10 |
Exponential Moving Averages (EMA) Levels
All moving averages are sloping upwards maintaining the long term uptrend.
| 200 EMA (Red Color) | 37372.39 |
| 100 EMA (White Color) | 41458.45 |
| 55 EMA (Blue Color) | 43853.21 |
| 34 EMA (Green Color) | 45100.82 |
| 21 EMA (Yellow Color) | 46315.95 |
Fixed Range Volume Profile Levels
The daily Point of Control and value areas signal strong support between $40,920-$45,000.
| Point of Control (POC) | Value Area High (VAH) | Value Area Low (VAL) |
| 42890.65 | 44992.76 | 40920.76 |
Invalidation Levels
The invalidation level is quite far down at $38,555, implying the current bullish structure remains robust.
| Invalidation Type (Long, Short) | Invalidation Price |
| invalidation | 38555.00 |
Relative Strength Index (RSI) Levels
The high RSI of 83.55 shows the market is overextended in the short term, so some consolidation or pullback could be expected.
Current RSI Level: 83.55