Bitcoin BTC USDT continues to demonstrate bullish structures on the longer-term charts, with solid demand persisting on pullbacks. The crowded RSI warns of a potential dip in the near-term to alleviate overbought pressures. Long positions initiated on deeper dips targeting the support, demand and Fibonacci levels outlined offers an attractive risk/reward considering the broader bull market remains intact as long as higher lows are made. Tight stops below key support keep risk defined.
That covers our technical analysis of Bitcoin based on the provided data. Let me know if any part needs more clarification or if you have additional questions. Overall, the market bias based on the evidence leans long, with dips representing attractive opportunities to put capital to work within this likely next leg higher within the secular bull run. Keep a close eye on support as pullbacks unfold.
The current price of BTC USDT is sitting at $51,949.35 as of our analysis date. Let’s take a closer look at some key technical indicators to gain insights into the potential near-term price action and determine whether the market presents a long or short opportunity.
Support Levels
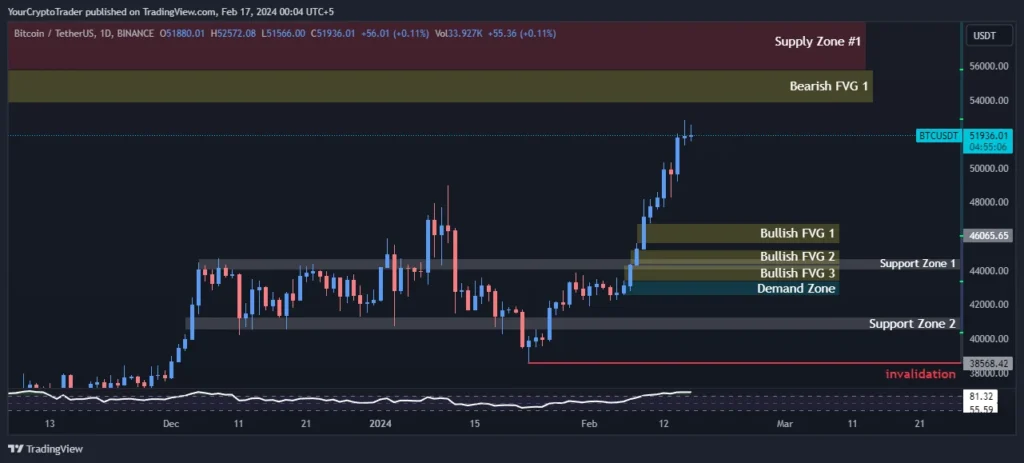
Bitcoin BTC USDT finds strong support just below the current price at $44,000-$44,700, as indicated by Support Zone 1. Below that, Support Zone 2 is located in the $41,300-$40,500 area. These support levels will be important to watch on any potential pullbacks, as holding above them would maintain the overall bullish structure.
| Support Zone Number | Price High | Price Low |
| Support Zone 1 | 44073.32 | 44731.10 |
| Support Zone 2 | 41300.00 | 40542.93 |
Fibonacci Retracement Levels
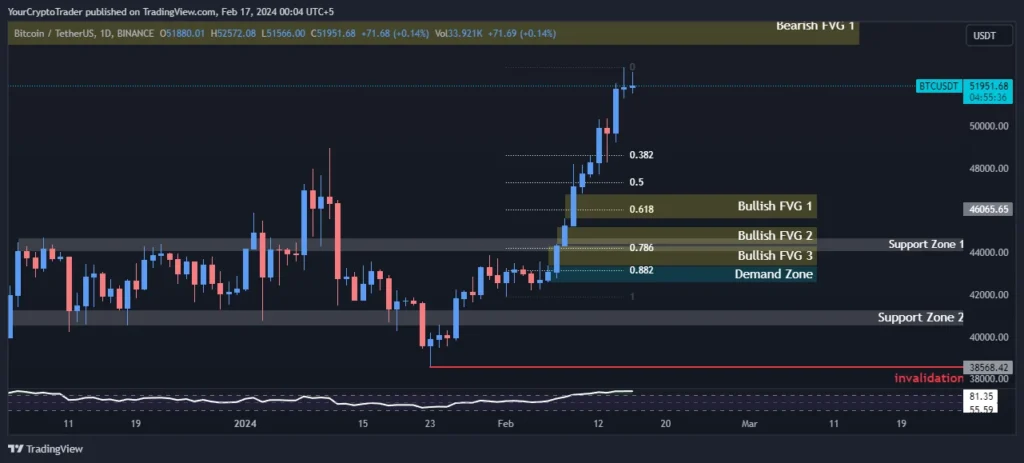
Since making its most recent higher low of $42,000 in mid-January, BTC has rallied over 20%. Applying Fibonacci retracement to this recent move higher reveals potential pullback zones. The 38.2% Fib level cuts across the $48,640 area, while the 50% level is near $47,348. Deeper pullbacks could find support around $46,055 (61.8% Fib) or $44,233 (78.6% Fib). These Fib levels align relatively well with the support zones, adding confluence to those areas as potential buy zones on weakness.
| Fib Retracement Value | Price |
| 0.382 Fib Level | 48640.40 |
| 0.50 Fib Level | 47347.68 |
| 0.618 Fib Level | 46054.68 |
| 0.786 Fib Level | 44232.58 |
| 0.882 Fib Level | 43172.65 |
Supply Zones
As mentioned, the nearest supply zone resides from $55,778-$59,177. Given the price is still some distance below this high price range, it highlights upside objectives on any continuation higher from here. Beyond this zone, it will take a break above the $60,000s to open the path towards fresh highs.
| Supply Zone Number | Price High | Price Low |
| Supply Zone #1 | 55777.77 | 59176.99 |
Demand Zones
Demand is seen accumulating between $43,400-$42,574, offering an attractive risk/reward entry point for long trades on a pullback. The bulls will want to see this area hold to maintain the broader uptrend.
| Demand Zone Number | Price High | Price Low |
| Demand Zone | 43399.98 | 42574.00 |
Fair Value Gaps / Imbalances (FVG)
These gaps represent areas where imbalances exist between buyers and sellers after significant price movements. The current price action sits directly between Bullish FVG #2 ($44,396-$45,242) and Bullish FVG #3 ($43,400-$44,331). Holding tightly between bullish FVG zones signals sustained buying pressure and points to upside bias. Meanwhile, Bearish FVG #1 between $55,778-$53,859 reinforces supply near the $55k level.
| FVG Zone Number | Price High | Price Low |
| Bearish FVG 1 | 55777.77 | 53859.10 |
| Bullish FVG 1 | 45614.30 | 46800.00 |
| Bullish FVG 2 | 44396.50 | 45242.12 |
| Bullish FVG 3 | 43399.98 | 44331.10 |
Fixed Range Volume Profile Levels
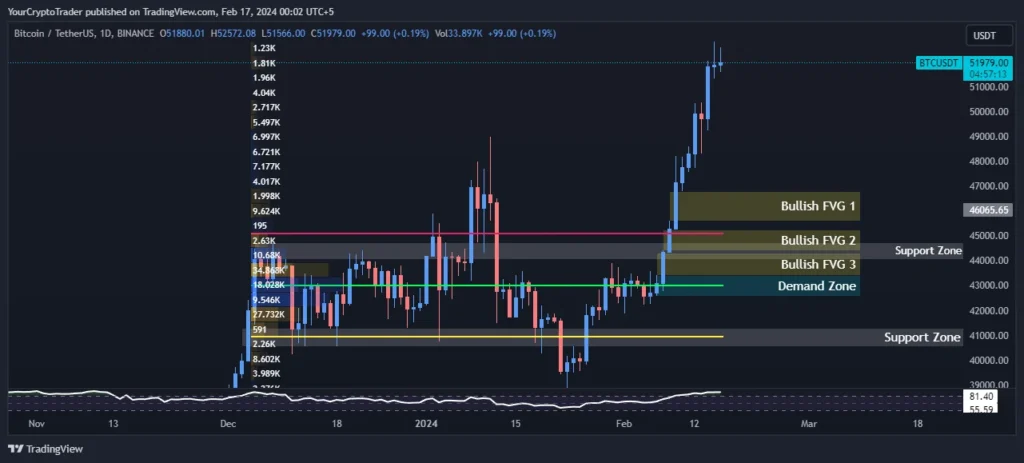
Volume analysis identifies a point of control (price with highest volume traded) at $43,010. The value area high and low, which encompasses roughly 70% of price/volume, stretches from $45,112 to $40,960. This range nicely correlates with demand and support zones, signaling institutional accumulation/distribution. Holding above this profile keeps buyers in control.
| Point of Control (POC) | Value Area High (VAH) | Value Area Low (VAL) |
| 43009.68 | 45111.78 | 40960.48 |
Relative Strength Index (RSI) Levels
The RSI has pushed to an extended overbought level of 81.35, raising the risk of a minor pullback to relieve overbought pressures and re-establish momentum. However, the underlying trend remains bullish as long as higher lows persist on retracements.
Current RSI Level: 81.35
Trade Bias
Trade Bias: Long
Entry Levels
| Entry Level Zone Number | Entry Level Price |
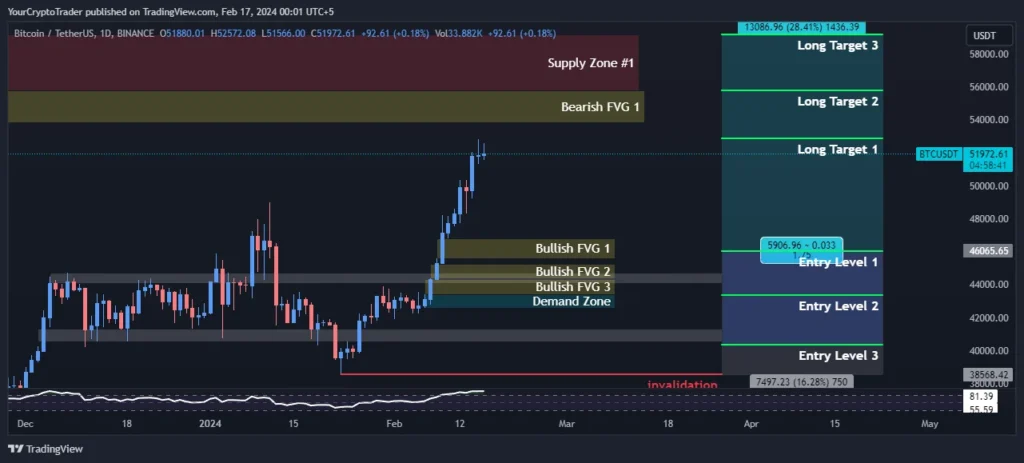
| Entry Level 1 | 46040.69 |
| Entry Level 2 | 43354.15 |
| Entry Level 3 | 40346.83 |
Invalidation Levels
A significant break below the long-term support zone at $38,555 could cast doubt on the primary uptrend and shift neutral to bearish. This level serves as the invalidation threshold for long positions.
| Invalidation Type (Long, Short) | Invalidation Price |
| Long | 38555.00 |
Target Levels
Considering the technical evidence overwhelmingly points to further upside within the bull trend, let’s propose the following levels:
| Target Level | Target Price |
| Long Target 1 | 52857.29 |
| Long Target 2 | 55784.41 |
| Long Target 3 | 59192.71 |