The technicals point to upside favoring momentum but suggest a period of consolidation, retest or pullback is likely before new highs are made. I would maintain a long bias with stops below key support levels.
The current price of BTC USDT is just above the 0.382 Fibonacci retracement level of 47184.89. This suggests we may see further upside potential in the near term as prices retest resistance levels.
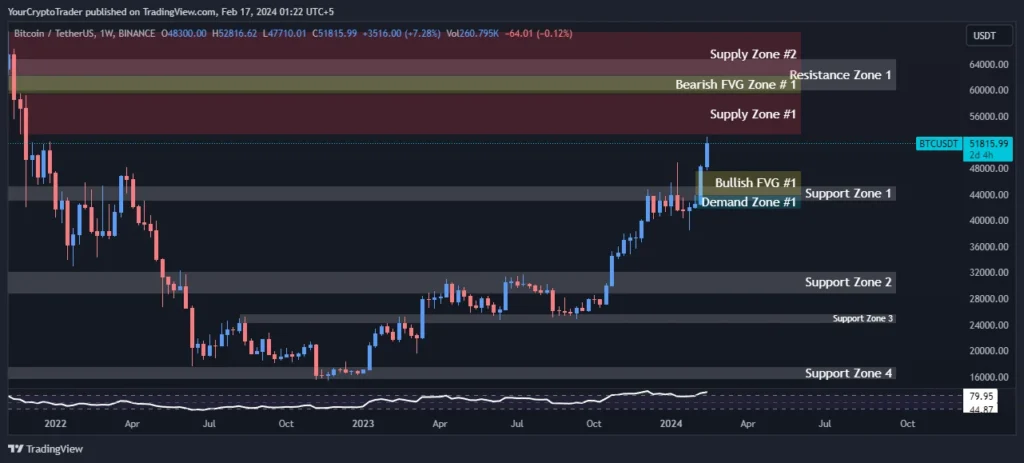
Support Levels
There are four identified support zones providing potential floors for the market. Strong support lies at Support Zone 1 between 45400-42976. A break below this level could see prices decline further. Support Zone 4 between 17622-15628 would represent a much larger decline and a potentially new longer term bear trend if broken.
| Support Zone Number | Price High | Price Low |
| Support Zone 1 | 45400.00 | 42976.00 |
| Support Zone 2 | 32259.90 | 28850.00 |
| Support Zone 3 | 24309.38 | 25722.92 |
| Support Zone 4 | 17622.00 | 15628.29 |
Resistance Levels
On the upside, the primary Resistance Zone lies between 59999-64854. A break above this level could confirm the resumption of the prior uptrend.
| Resistance Zone Number | Price High | Price Low |
| Resistance Zone | 59998.80 | 64854.00 |
Fibonacci Retracement Levels
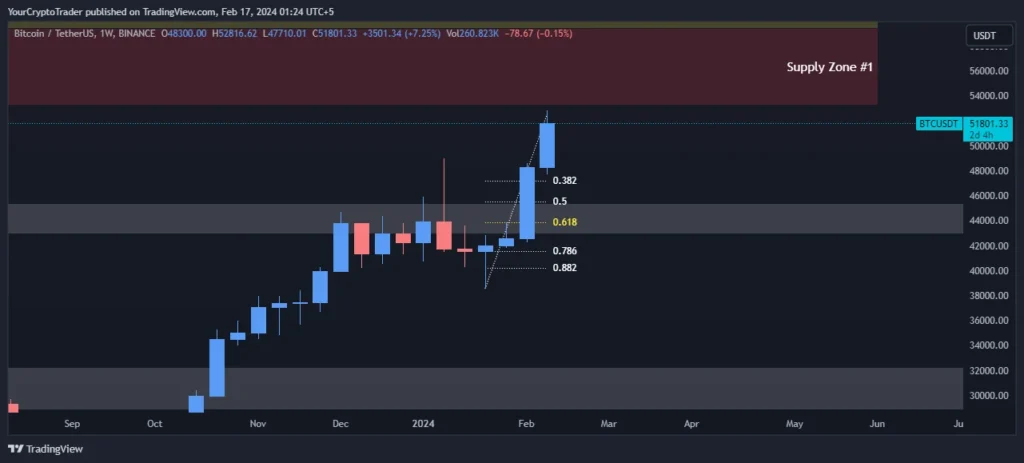
| Fib Retracement Value | Price |
| 0.382 Fib Level | 47184.89 |
| 0.50 Fib Level | 45523.85 |
| 0.618 Fib Level | 43889.75 |
| 0.786 Fib Level | 41532.45 |
| 0.882 Fib Level | 40193.80 |
Supply Zones
Supply Zones 1 and 2 between 53256-69000 overhang the current price and may cap further upside before being overcome. The Demand Zone between 43882-41804 lines up with the 0.618 Fibonacci retracement and could attract fresh buying interest on a price dip.
| Supply Zone Number | Price High | Price Low |
| Supply Zone #1 | 53256.64 | 59444.00 |
| Supply Zone #2 | 62278.00 | 69000.00 |
Demand Zones
| Demand Zone Number | Price High | Price Low |
| Demand Zone | 43882.36 | 41804.88 |
Fair Value Gaps / Imbalances (FVG)
The bullish Fair Value Gap between 43882-47710 supports the case for higher prices, as gaps tend to be filled. The bearish FVG between 62278-59444 may engulf prices short term.
| FVG Zone Number | Price High | Price Low |
| Bullish FVG | 43882.36 | 47710.01 |
| Bearish FVG Zone | 62278.00 | 59444.00 |
Fixed Range Volume Profile Levels
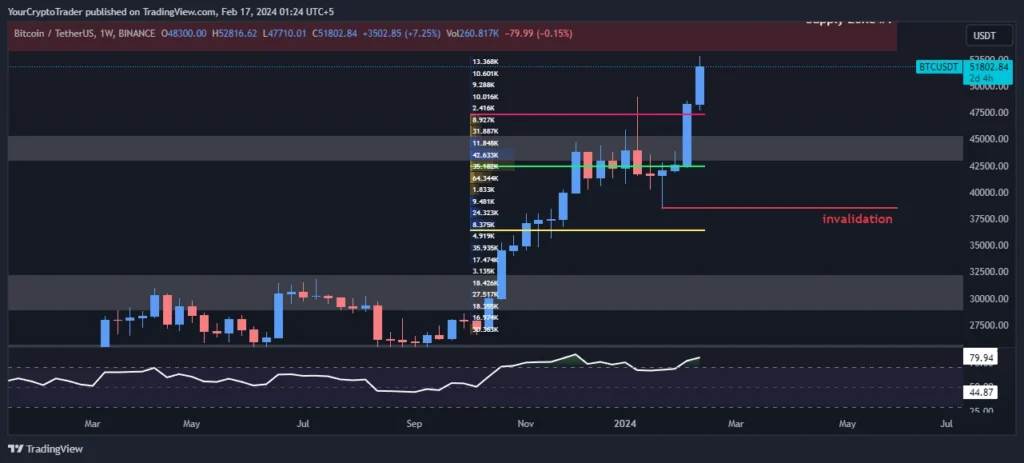
The Point of Control on the volume profile at 42554 provides an upside target, while the lower Value Area at 36415 gives an estimation of potential downside.
| Point of Control (POC) | Value Area High (VAH) | Value Area Low (VAL) |
| 42554.67 | 47466.11 | 36415.65 |
Relative Strength Index (RSI) Levels
The RSI currently at 80.75, the market is extended and due for a potential dip to work off overbought conditions before further appreciation.
Current RSI Level: 80.75