The daily and 4 hour timeframes indicate that Celestia TIA USDT is in an upside consolidation with support seen at demand zones and Fibonacci retracement levels.
The 1 hour timeframe shows that short term momentum has turned positive. A break above the $19.7834 supply zone could signal the start of the next leg higher with targets of $20.3963 resistance zone 1.
Traders can look to enter long positions on dips towards support with tight stops below demand zones.
Daily Timeframe
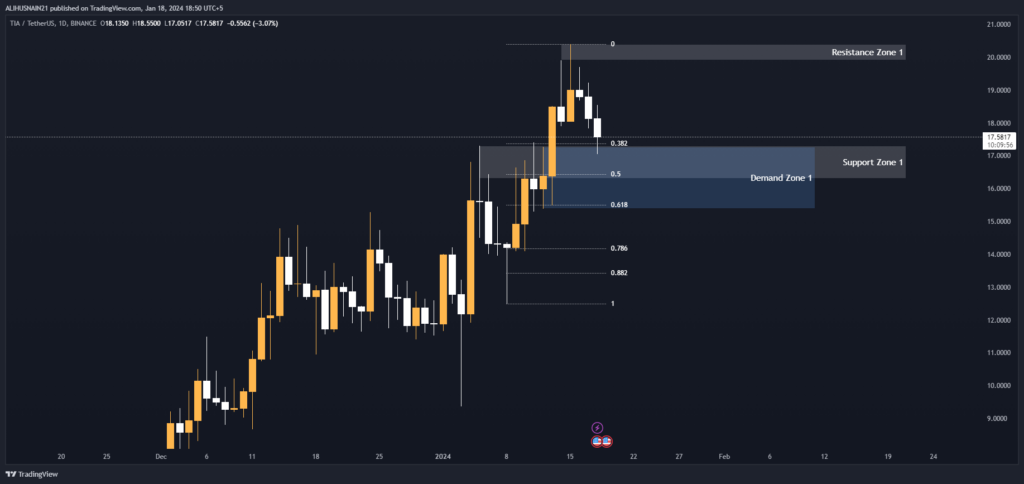
On the daily chart, the price is currently trading sideways within the demand zone of $17.2639 – $15.3810 identified on the weekly timeframe.
Short term support lies at the 38.2% Fibonacci retracement level of $17.3564 and the low of demand zone 1. Medium term resistance is seen at $19.9000 the bottom of resistance zone 1 identified on the weekly chart.
As long as the price remains above the 50% retracement level of $16.4378, the short term trend remains bullish. A break below this level could see the price target the 0.618 Fibonacci level at $15.5056.
However, the confirmation of an uptrend would come on a close above $19.9000 resistance.
Support and Resistance Levels
| S / R Type | High | Low |
| Resistance Zone 1 | 20.3963 | 19.9000 |
| Support Zone 1 | 17.2987 | 16.3017 |
Fibonacci Retracement Levels
| 0.382 | 17.3564 |
| 0.50 | 16.4378 |
| 0.618 | 15.5056 |
| 0.786 | 14.1817 |
| 0.882 | 13.4252 |
Demand Zone
| Zone Number | High | Low |
| Demand Zone 1 | 17.2639 | 15.3810 |
4 Hour Timeframe
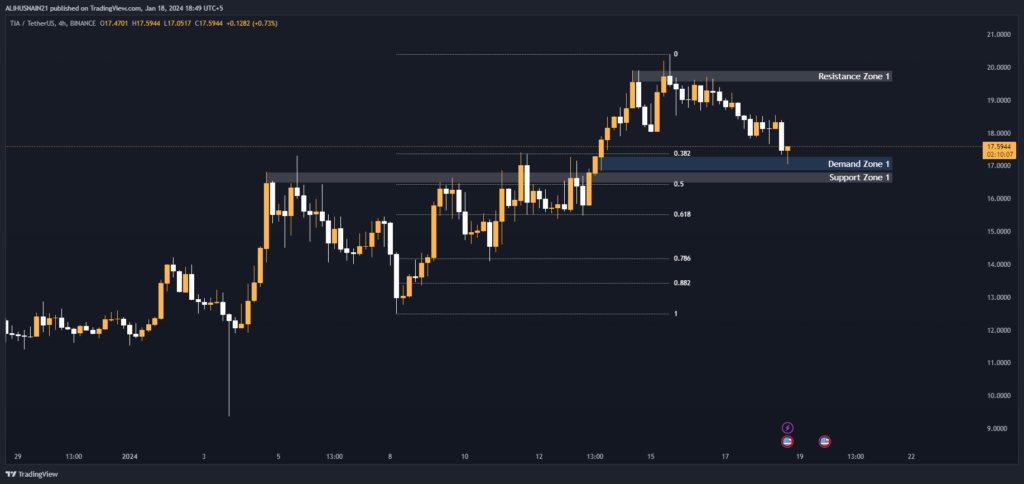
On the 4 hour chart, the price action since yesterday has formed an ascending triangle pattern with resistance at $19.9000 – $19.5500 and support at $16.8135 – $16.4800.
The breakout level for this pattern is the resistance zone. A break above this level would serve as a confirmation of the continuation of the short term uptrend with targets of $20.3963 at resistance zone 1 on the weekly chart.
Inside the pattern, support lies at the demand zone of $17.2900 – $16.8432 identified on the daily chart as well as the 38.2% Fibonacci level.
As long as the price remains above horizontal support, the likelihood of an upside breakout remains high.
Support and Resistance Levels
| S / R Type | High | Low |
| Resistance Zone 1 | 19.9000 | 19.5500 |
| Support Zone 1 | 16.8135 | 16.4800 |
Fibonacci Retracement Levels
| 0.382 | 17.3834 |
| 0.50 | 16.4513 |
| 0.618 | 15.5056 |
| 0.786 | 14.1817 |
| 0.882 | 13.4252 |
Demand Zone
| Zone Number | High | Low |
| Demand Zone 1 | 17.2900 | 16.8432 |
1 Hour Timeframe
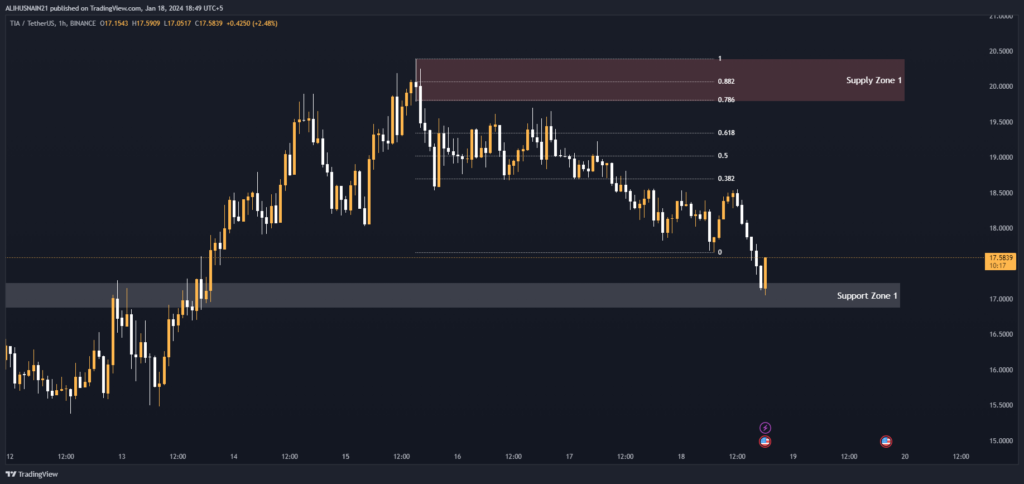
On the 1 hour timeframe, the price action is range-bound between support at $17.2345 – $16.8700 and resistance at the supply zone of $20.3963 – $19.7834 identified on the weekly chart.
Short term momentum has turned positive as indicated by the price trading above the short term simple moving averages. Immediate upside targets are seen at the 0.5 and 0.618 Fibonacci retracement levels of $19.0316 and $19.3423 respectively.
A break above the supply zone could see the price make a run towards resistance zone 1 on the weekly chart of $20.3963.
On the downside, only a break below $16.8700 support would negate the short term positive outlook for Celestia.
Support and Resistance Levels
| S / R Type | High | Low |
| Support Zone 1 | 17.2345 | 16.8700 |
Fibonacci Retracement Levels
| 0.382 | 18.7073 |
| 0.50 | 19.0316 |
| 0.618 | 19.3423 |
| 0.786 | 19.8151 |
| 0.882 | 20.0718 |
Supply Zone
| Zone Number | High | Low |
| Supply Zone 1 | 20.3963 | 19.7834 |