While consolidation seems to be unfolding on the 4 hour and 1 hour charts of Celestia (TIA USDT), initial signs of potential short term recovery are present.
However, numerous resistance levels and zones exist that may halt the upside. A break above $18.1311 on the 4 hour and $17.2021 on the 1 hour would constitute bullish continuation signals. Until then, rangebound sideways trading is expected to continue.
4 Hour Timeframe
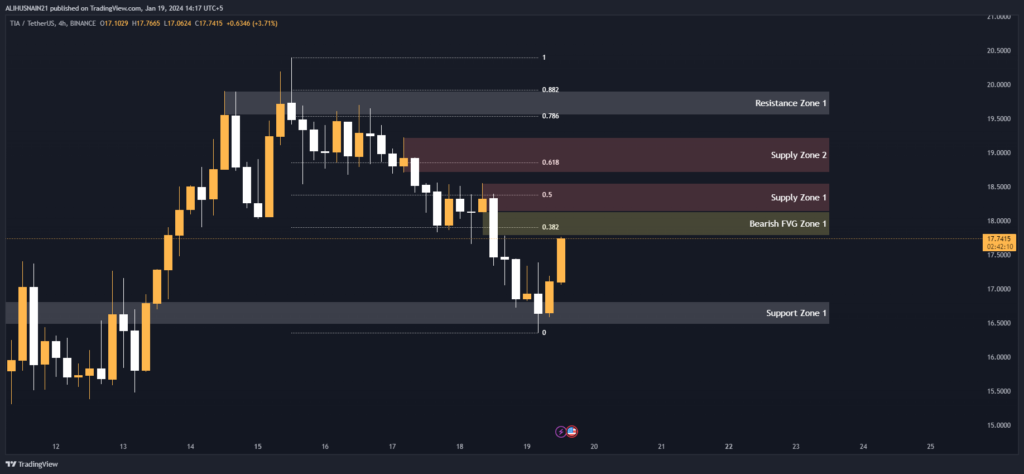
Celestia (TIA USDT) has established some key support and resistance levels over the past few weeks based on the 4 hour timeframe. There is a support zone between $16.8135-$16.4800 that the price has bounced off of multiple times. Above that is resistance at $19.9000-$19.5500 that has capped rallies.
Looking at Fibonacci retracement levels from the most recent swing high to low, the 0.382 level at $17.9032 and 0.50 level at $18.3732 will act as areas of resistance. A break above the 0.618 level at $18.8509 could indicate the start of a new uptrend. On the downside, support lies at the 0.786 and 0.882 levels of $19.5289 and $19.9219 respectively.
Supply zones have also formed where selling pressure is likely to emerge. There is a supply zone between $18.5500-$18.1311 and another stronger zone from $18.7089-$19.2246 that may stall any upside momentum.
In addition, a bearish fair value gap exists from $18.1311-$17.7770, indicating an imbalance that will likely be filled if the price approaches this range. Gaps tend to act as magnets that draw the price towards them.
Based on the current price of $17.68, Celestia is finding support within the lower range of the support zone. Momentum seems to be slowing, but as long as the $16.8135 level holds, the short term trend remains neutral to bullish. The first level of meaningful resistance lies at $18.1311 at the bottom of the first supply zone. A four hour close above there would imply the next leg higher has started.
Support and Resistance Levels
| S / R Type | High | Low |
| Support Zone 1 | 16.8135 | 16.4800 |
| Resistance Zone 1 | 19.9000 | 19.5500 |
Fibonacci Retracement Levels
| 0.382 | 17.9032 |
| 0.50 | 18.3732 |
| 0.618 | 18.8509 |
| 0.786 | 19.5289 |
| 0.882 | 19.9219 |
Supply Zone
| Zone Number | High | Low |
| Supply Zone 1 | 18.5500 | 18.1311 |
| Supply Zone 2 | 18.7089 | 19.2246 |
Fair Value Gaps / Imbalances
| Gap Number | High | Low |
| Bearish FVG Zone 1 | 18.1311 | 17.7770 |
1 Hour Timeframe
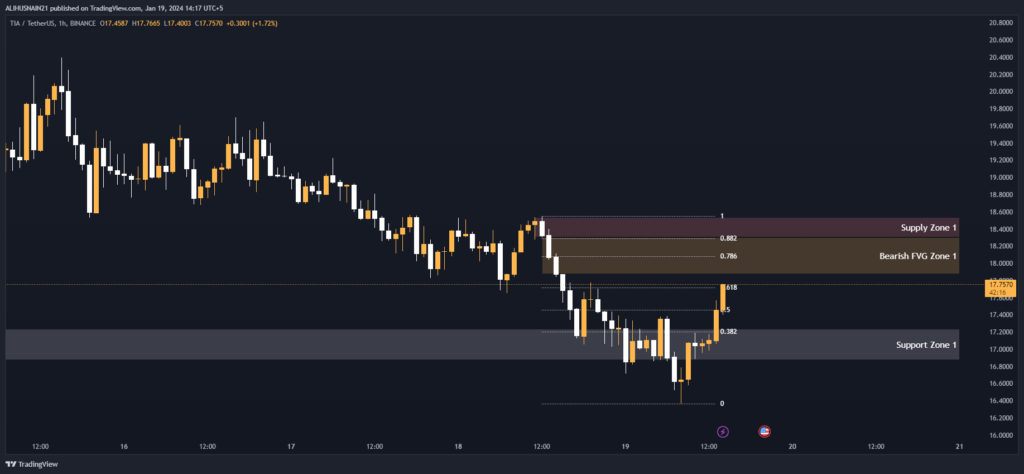
Zooming into the 1 hour chart, we can get a closer look at the recent price action. Support is found between $17.2345-$16.8700, with resistance at the Fib 0.382 level of $17.2021 currently capping the recovery.
The 0.50 and 0.618 Fib levels line up closely near current prices and will need to be broken for bullish continuation. Above that, strong resistance exists from $18.0804-$18.2962. Holding these levels would keep bearish pressure intact in the near term.
A supply zone has taken shape between $18.5357-$18.2999 that may stall further upwards momentum. In addition, a bearish FVG zone exists from $18.2999-$17.8768 that is yet to be filled.
The 1 hour RSI has dropped back towards oversold levels, indicating a potential bounce may be unfolding. However, selling pressure could persist on approach to supply zones and Fibonacci resistance levels. As long as $16.8700 support holds on hourly closes, the short term outlook remains sideways to up. But a break below would shift bias back to bearish.
Support and Resistance Levels
| S / R Type | High | Low |
| Support Zone 1 | 17.2345 | 16.8700 |
Fibonacci Retracement Levels
| 0.382 | 17.2021 |
| 0.50 | 17.4563 |
| 0.618 | 17.7183 |
| 0.786 | 18.0804 |
| 0.882 | 18.2962 |
Supply Zone
| Zone Number | High | Low |
| Supply Zone 1 | 18.5357 | 18.2999 |
Fair Value Gaps / Imbalances
| Gap Number | High | Low |
| Bearish FVG Zone 1 | 18.2999 | 17.8768 |