LINK USDT remains in a weekly downtrend but daily support is forming. Shorter timeframes provide targets for bounces and potential selling pressure zones, with fair value gaps also signaling potential reversals or pauses along the way.
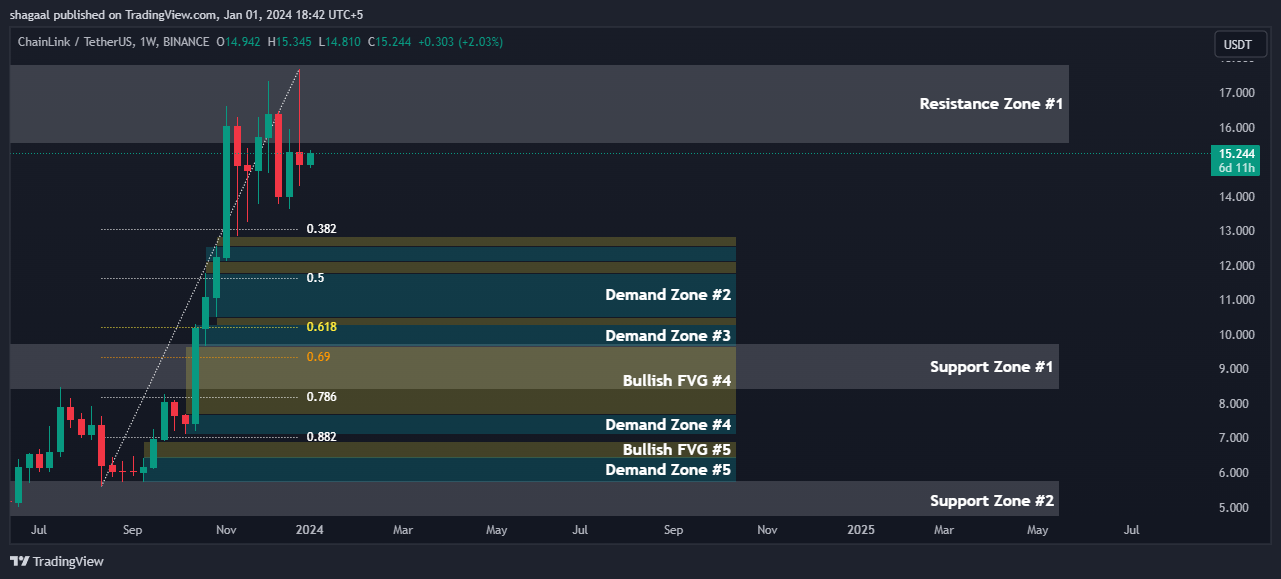
LINK is in a downtrend on the weekly timeframe based on lower highs and lower lows over the past few months.
The price is currently finding support at around the 8.412 level, which is Support Zone #1. Additional stronger support lies below at 4.617.
Resistance levels to watch that could pause or reverse any recovery attempts are at 15.540, 27.533, and 35.45 – Resistance Zones 1, 2, and 3 respectively.
A bounce off the current support levels could see retracements to the Fibonacci levels of 13.051, 11.659, 10.209, or higher levels.
Two large supply zones overhead from 23.910-28.710 and 31.900-38.310 could see the price reverse back down if reached.
Multiple demand zones below from 12.559-7.100 provide potential buying opportunities on a deeper pullback.
Fair value gaps and imbalances show areas where the price may pause on moves up or down.
Support and Resistance Levels
Support Zone #1
8.412
Support Zone #2
4.617
Resistance Zone #1
15.540
Resistance Zone #2
27.533
Resistance Zone #3
35.450
Fibonacci Retracement Levels
0.382
13.051
0.50
11.659
0.618
10.209
0.69
9.350
0.786
8.168
0.882
7.023
Supply Zone
Zone Number
High
Low
Supply Zone #1
23.910
28.710
Supply Zone #2
31.900
38.310
Demand Zone
Zone Number
High
Low
Demand Zone #1
12.559
12.118
Demand Zone #2
11.788
10.500
Demand Zone #3
10.288
9.661
Demand Zone #4
7.696
7.100
Demand Zone #5
6.470
5.719
Fair Value Gaps / Imbalances
Gap Number
High
Low
Bullish FVG / Imbalance Zone #1
12.853
12.559
Bullish FVG / Imbalance Zone #2
12.118
11.788
Bullish FVG / Imbalance Zone #3
10.500
10.274
Bullish FVG / Imbalance Zone #4
9.661
7.696
Bullish FVG / Imbalance Zone #5
6.908
6.421
Bearish FVG / Imbalance Zone #1
23.910
19.540
Bearish FVG / Imbalance Zone #2
31.900
28.710
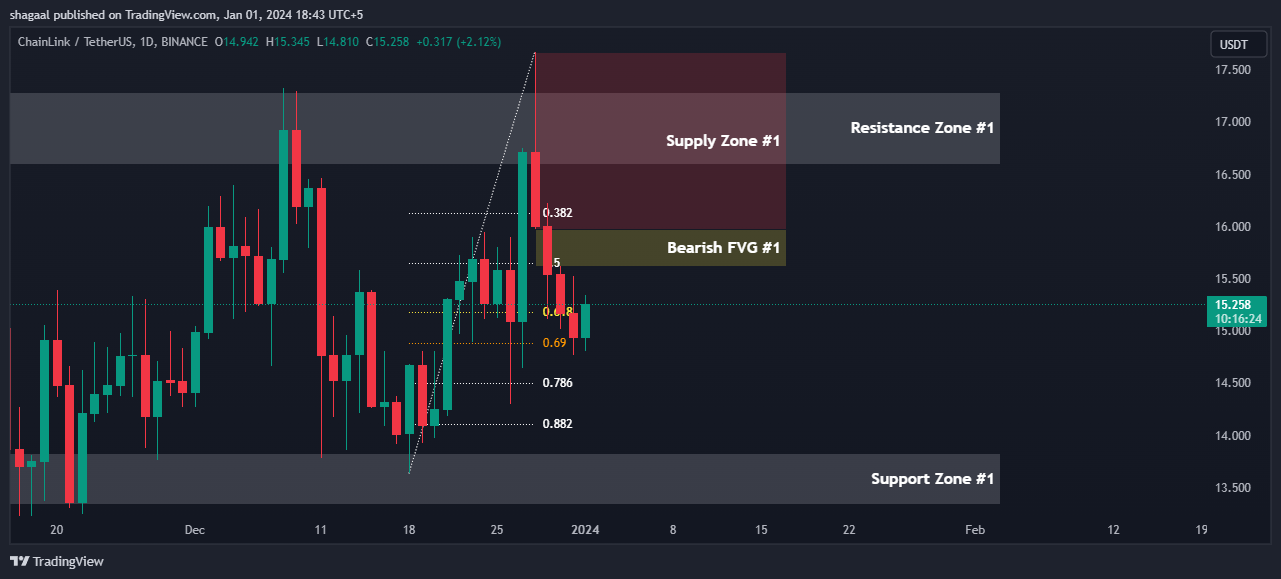
Daily Timeframe
On the daily chart, LINK is presently finding support at 13.824.
Resistance is seen at 16.600, with a supply zone from 15.975-17.672 that could see selling pressure emerge.
A fair value gap from 15.975-15.623 shows an area of potential pause on further downside movement.
Support and Resistance Levels
Support Zone #1
13.824
Resistance Zone #1
16.600
Fibonacci Retracement Levels
0.382
16.131
0.50
15.655
0.618
15.184
0.69
14.882
0.786
14.500
0.882
14.109
Supply Zone
Zone Number
High
Low
Supply Zone #1
15.975
17.672
Fair Value Gaps / Imbalances
Gap Number
High
Low
Bearish FVG #1
15.975
15.623
4 Hour Timeframe
Fibonacci retracement levels provide targets for short-term bounces in the 14.5-17.3 range.
Supply zones from 15.714-16.224 and 16.875-17.322 could see sellers enter.
Fair value gaps at 15.714-15.662 and 16.875-16.518 may induce short-term pauses or reversals.
Fibonacci Retracement Levels
0.382
15.972
0.50
16.294
0.618
16.623
0.786
17.082
0.882
17.349
Supply Zone
Zone Number
High
Low
Supply Zone #1
15.714
16.224
Supply Zone #2
16.875
17.322
Fair Value Gaps / Imbalances
Gap Number
High
Low
Bearish FVG #1
15.714
15.662
Bearish FVG #2
16.875
16.518
1 Hour Timeframe
Near-term retracement targets are seen at the Fibonacci levels within the 15.9-17.3 range.
Supply zones exist from 15.818-16.192, 16.296-16.509, and 16.960-17.322.
A fair value gap from 15.818-15.638 may induce a temporary bounce.