Doge coin remains in a daily and weekly downtrend but has found support currently. A break above resistance on lower timeframes could signal a larger reversal. Key levels have been outlined on each timeframe for traders to be aware of.
On the weekly timeframe, Dogecoin is in a downtrend based on lower highs and lower lows over the past few months. Price is currently testing the bottom of Support Zone #1 between $0.04914 – $0.05930 as support. Above this zone, Resistance Zone #1 between $0.09980 – $0.11652 will need to be broken for the trend to turn bullish. Price is also testing the 0.618 Fibonacci retracement level of $0.07608. A bounce off this support could see a retest of the supply zone overhead between $0.11183 – $0.15893.
Support and Resistance Levels
S/R Type
High
Low
Support Zone #1
0.05930
0.04914
Resistance Zone #1
0.11652
0.09980
Supply Zone
Zone Number
High
Low
Supply Zone #1
0.15893
0.11183
Demand Zone
Zone Number
High
Low
Demand Zone #1
0.08219
0.07063
Demand Zone #2
0.06176
0.05678
Fibonacci Retracement Levels
0.382
0.08799
0.50
0.08204
0.618
0.07608
0.786
0.06753
0.882
0.06273
Fair Value Gaps / Imbalances
Gap Number
High
Low
Bullish FVG #1
0.08540
0.08219
Bullish FVG #2
0.06176
0.06548
Daily Timeframe
The daily chart shows Dogecoin continuing its downtrend with lower highs and lows. Price recently found support at Support Zone #2 between $0.05506 – $0.05940 before rebounding. It is now approaching Resistance Zone #1 between $0.09506 – $0.10690. A break above this level could see further upside back towards the supply zone on the weekly chart. The 0.382, 0.50, and 0.618 Fibonacci retracement levels at $0.09330, $0.08893, and $0.08465 respectively will also provide resistance.
Support and Resistance Levels
S/R Type
High
Low
Support Zone #1
0.07401
0.07881
Support Zone #2
0.05506
0.05940
Resistance Zone #1
0.10690
0.09506
Fibonacci Retracement Levels
0.382
0.09330
0.50
0.08893
0.618
0.08465
0.786
0.07850
0.882
0.07493
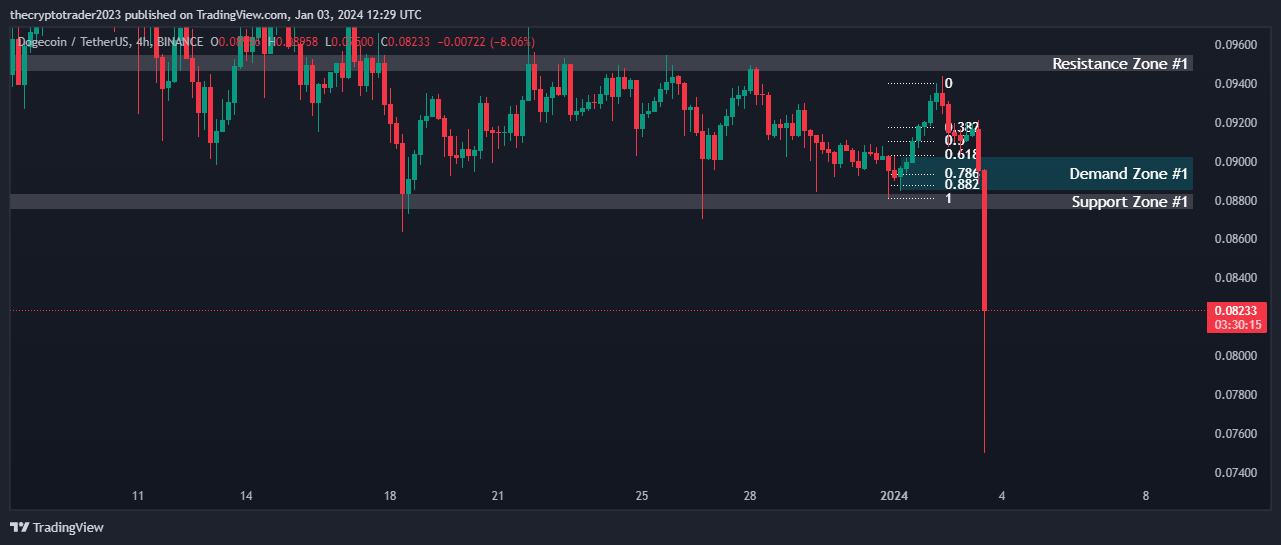
4 Hour Timeframe
On the 4hr timeframe, Dogecoin is trading inside an ascending parallel channel. Price recently bounced off Support Zone #1 between $0.08751 – $0.08834 and is currently testing Resistance Zone #1 between $0.09458 – $0.09551. A break above this level could see another test of the $0.09 level. The 0.382, 0.50 and 0.618 Fibonacci retracement levels will provide resistance at $0.09171, $0.09103, and $0.09033 respectively. Bullish FVGs between $0.09264 – $0.09207 and $0.09066 – $0.09015 signal potential buy zones if revisited.
Support and Resistance Levels
S/R Type
High
Low
Support Zone #1
0.08751
0.08834
Resistance Zone #1
0.09551
0.09458
Fibonacci Retracement Levels
0.382
0.09171
0.50
0.09103
0.618
0.09033
0.786
0.08935
0.882
0.08877
Demand Zone
Zone Number
High
Low
Demand Zone #1
0.08847
0.09028
Fair Value Gaps / Imbalances
Gap Number
High
Low
Bullish FVG #1
0.09264
0.09207
Bullish FVG #2
0.09066
0.09015
1 Hour Timeframe
On the 1hr chart, Dogecoin is bouncing between Support Level #1 at $0.08874 – $0.08947 and Resistance Level #1 at $0.09425 – $0.09493. A break above resistance could signal further upside momentum in the short term. The 0.382, 0.50, and 0.618 Fibonacci retracement levels will provide resistance at $0.09196, $0.09123, and $0.09050 respectively.