The current price of DOT USDT is $6.561 according to the charts. Below is a breakdown of key support and resistance levels, demand zones, and fair value gaps that could impact DOT USDT price movement over the coming hours.
Keep a close eye on the Fibonacci retracement levels and demand zone for potential areas of support. A break below $6.448 would shift momentum more bearishly in the near term and open the door for a retest of the demand zone.
Alternatively, holding a range above $6.503 maintains buy-side structure. Use pullbacks as potential low risk entries, with appropriate protective stops set below demand zones. Let me know if any part of the analysis needs more clarification or expansion.
1 Hour Timeframe Analysis
Fibonacci Retracement Levels
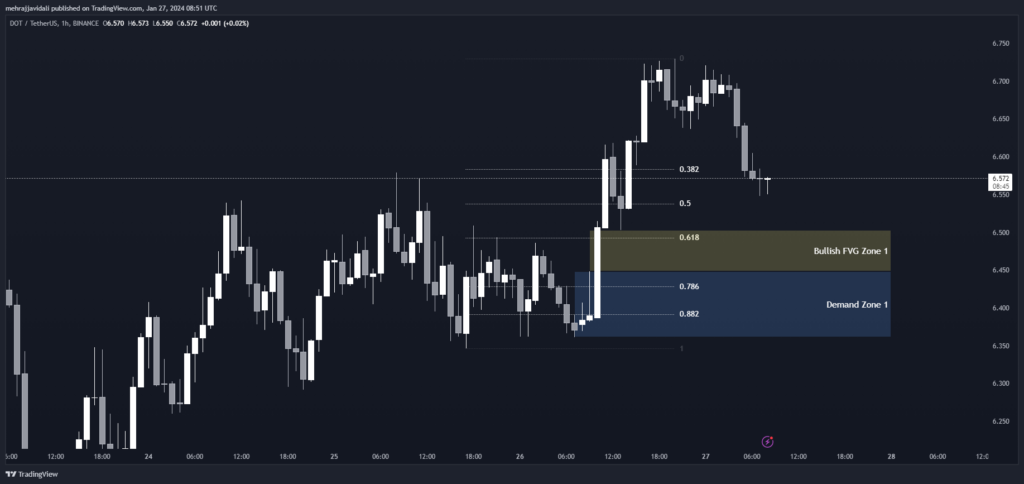
As you can see from the table, there are several important Fibonacci retracement levels that may act as support or resistance for DOT USDT price. These include the 0.382, 0.50, 0.618, 0.786 and 0.882 levels.
Pay close attention to the 0.50 and 0.618 levels in particular, as prices tend to find support (or bounce off of) these areas. If the 0.618 level at $6.492 breaks to the downside, it would indicate strengthening bearish momentum.
| 0.382 | 6.583 |
| 0.50 | 6.539 |
| 0.618 | 6.492 |
| 0.786 | 6.428 |
| 0.882 | 6.391 |
Demand Zone
| Zone Number | High | Low |
| Demand Zone 1 | 6.448 | 6.361 |
Fair Value Gaps / Imbalances
Fair value gaps are spaces on the chart where there is an absence of trading activity and no recorded price action. The bullish fair value gap noted between $6.503-$6.448 likely acted as resistance during a previous up move.
This zone now turns into an area of potential support if prices pull back to retest it. Holding above this level would keep the short-term technical advantage with the bulls.
| Gap Number | High | Low |
| Bullish FVG Zone 1 | 6.503 | 6.448 |