Polkadot, or DOT, has seen significant volatility over the past several weeks. In this article, we will analyze DOT USDT on the 1 hour timeframe to look for potential opportunities in both the long and short term.
Proper analysis of timeframes from the daily down to the hourly can provide valuable insights on current market structure and potential areas of support or resistance.
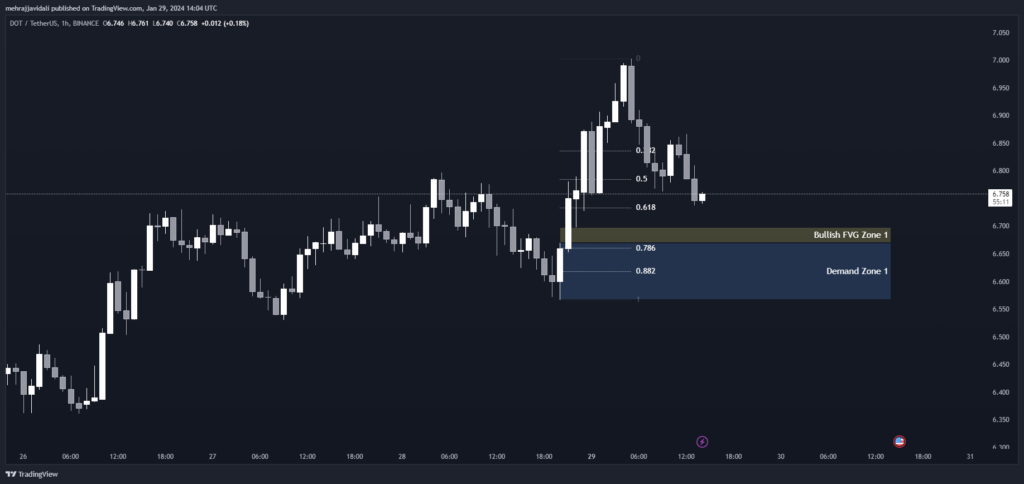
1 Hour Timeframe
Proper analysis of multiple timeframes and technical indicators is necessary for traders to make well-defined risk/reward entry and exit decisions. DOT USDT on the hourly chart still shows bullish structure that may see further upside in the near term as long as price can hold key support zones.
Trading ranges also provide lower-risk opportunities for scaling into positions. Overall market sentiment will ultimately dictate DOT USDT next directional move in the weeks ahead. Strict risk management discipline should be applied on any new positions.
Fibonacci Retracement Levels
As of writing, the current price of DOT USDT is $6.776. To gain a better understanding of potential resistance levels overhead, we can analyze Fibonacci retracement levels from the most recent major swing high to low. The key Fibonacci retracement levels are:
- 0.382 retracement at $6.837
- 0.50 retracement at $6.785
- 0.618 retracement at $6.733
- 0.786 retracement at $6.661
- 0.882 retracement at $6.618
These Fibonacci levels provide potential resistance zones that traders will look to take profits if the price pushes higher. Monitoring how the price reacts at these levels can give insight into the strength or weakness of the current trend.
| 0.382 | 6.837 |
| 0.50 | 6.785 |
| 0.618 | 6.733 |
| 0.786 | 6.661 |
| 0.882 | 6.618 |
Demand Zone
To identify potential support zones where buyers may look to enter or average into a position, we can analyze demand zones by connecting multiple touches or lows within a defined range.
On the 1 hour chart, we see a demand zone from $6.670 to $6.567. If price were to retrace back down into this zone, it could present an area where long positions are entered or scales-in for a potential reversal higher.
Demand zones give high probability areas of potential lower-risk entries for traders.
| Zone Number | High | Low |
| Demand Zone 1 | 6.670 | 6.567 |
Fair Value Gaps / Imbalances
A fair value gap, or FVG, occurs when there is a gap between an orderly high and low that has yet to be filled by normal price action. Leaving isolated gaps can create an imbalance that the market typically looks to correct over time.
On the 1 hour chart, we see an unfinished bullish FVG from $6.698 to $6.670. If price were to retrace into this area, it could fill this gap and continue higher, presenting another potential lower-risk entry zone.
| Gap Number | High | Low |
| Bullish FVG Zone 1 | 6.698 | 6.670 |
Potential Scenarios on DOT USDT From the analysis above, we can identify some potential scenarios on DOT USDT in the near term:
- Continuation Higher: If buyers can push price above the current price and through the 0.382 Fibonacci level at $6.837, this would signal a continuation of the upside momentum in the short term. Subsequent resistance then lies at the 0.50 level at $6.785.
- Retracement and Range: If selling pressure increases and price re-enters the demand zone between $6.670-$6.567, this could lead to a period of consolidation and range-bound trading before the next major impulse leg in either direction.
- Bearish Break: A failure to hold the demand zone support and closes below $6.567 would be the first signal that the recent uptrend may be coming to an end in favor of an extended correction lower on DOT USDT.
- Gap Fill Retracement: Price pulling back into the bullish FVG zone between $6.698-$6.670 could provide an opportunistic trade back to the upside to fill the gap. Traders would look to enter on a bullish reversal signal within this zone.