However, bearish signals are forming on the short term timeframes pointing to potential further downside in the near term before support is found and an uptrend resumes on lower timeframes.
Key levels to watch for potential long entries are support zones on the daily and weekly, with upside targets between resistance zone 1 and supply zone 1 overhead on higher timeframes if bullish momentum returns.
Weekly Timeframe
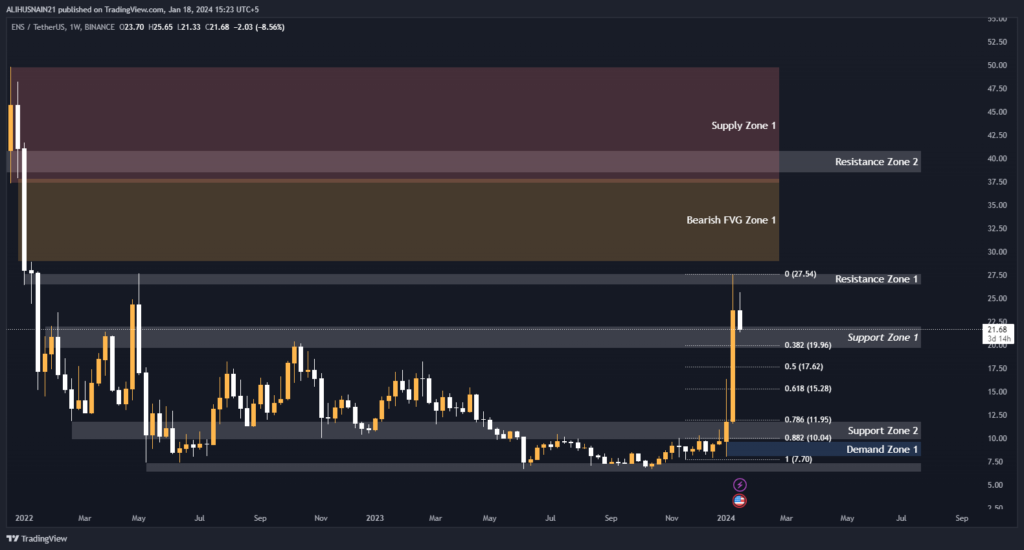
On the weekly timeframe, ENS USDT is currently trading between the support zone 1 at $22-19.60 and resistance zone 1 at $27.64-26.43. The price is also at the 0.618 Fibonacci retracement level of $23.53.
There is a significant supply zone 1 overhead at $49.80-37.31 which could pose resistance. Below are key demand zones that the price may find support on declines, with demand zone 1 at $9.68-8 being the strongest.
Overall, the weekly timeframe is suggesting the long term trend remains bullish while above support zone 1.
Support and Resistance Levels
S / R Type
High
Low
Support Zone 1
22.00
19.60
Support Zone 2
11.81
9.82
Support Zone 3
7.35
6.34
Resistance Zone 1
27.64
26.43
Resistance Zone 2
40.82
38.39
Fibonacci Retracement Levels
0.382
22.71
0.50
23.12
0.618
23.53
0.786
24.12
0.882
24.46
Supply Zone
Zone Number
High
Low
Supply Zone 1
49.80
37.31
Demand Zone
Zone Number
High
Low
Demand Zone 1
9.68
8.00
Fair Value Gaps / Imbalances
Gap Number
High
Low
Bearish FVG Zone 1
37.82
28.90
Daily Timeframe
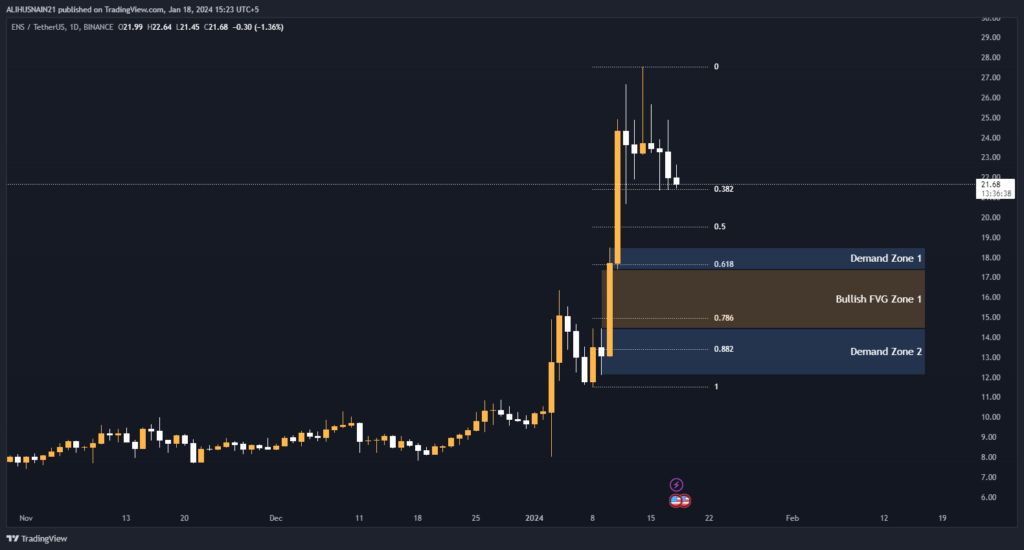
On the daily chart, the price is trading between the 0.618 Fibonacci retracement level of $17.12 and resistance zone 1 overhead. Recent price action has formed a bullish FVG between $17.40-14.45 which signals upside potential if the gap is filled.
Below this is demand zone 1 at $18.49-17.40 and demand zone 2 at $14.45-12.11. A break below demand zone 2 may signal a deeper pullback towards support zone 1 on the weekly chart.
Fibonacci Retracement Levels
0.382
20.92
0.50
19.02
0.618
17.12
0.786
14.43
0.882
12.88
Demand Zone
Zone Number
High
Low
Demand Zone 1
18.49
17.40
Demand Zone 2
14.45
12.11
Fair Value Gaps / Imbalances
Gap Number
High
Low
Bullish FVG Zone 1
17.40
14.45
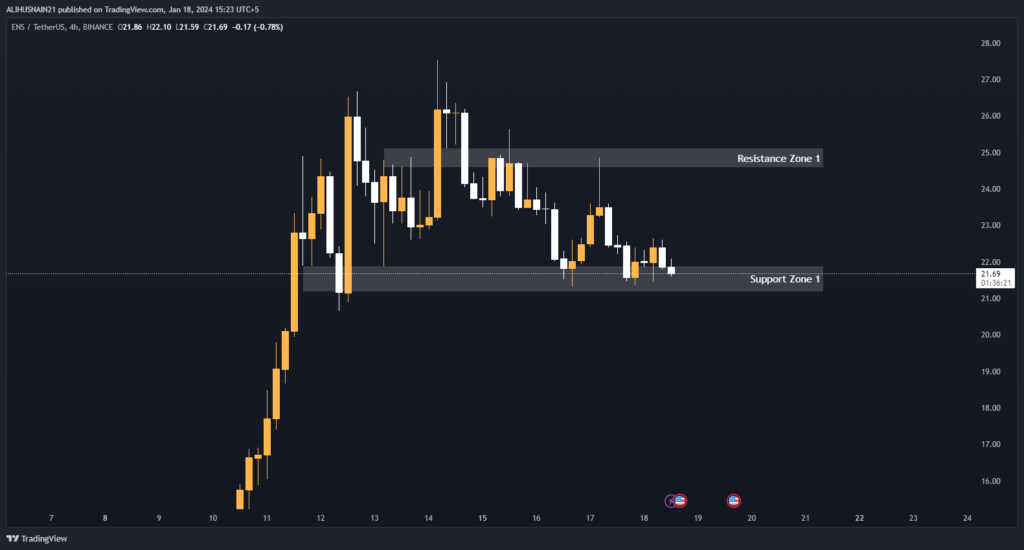
4 Hour Timeframe
On the 4 hour timeframe, ENS USDT is finding support at support zone 1 between $21.90-21.17. Above this, resistance zone 1 sits at $26.54-25.99. The price is currently hovering around the 0.618 Fibonacci retracement level of $23.53 where indecision is occurring.
A break above resistance zone 1 could see the price test the supply zone 1 overhead on the daily chart.
Support and Resistance Levels
S / R Type
High
Low
Support Zone 1
21.90
21.17
Resistance Zone 1
26.54
25.99
Fibonacci Retracement Levels
0.382
22.71
0.50
23.12
0.618
23.53
0.786
24.12
0.882
24.46
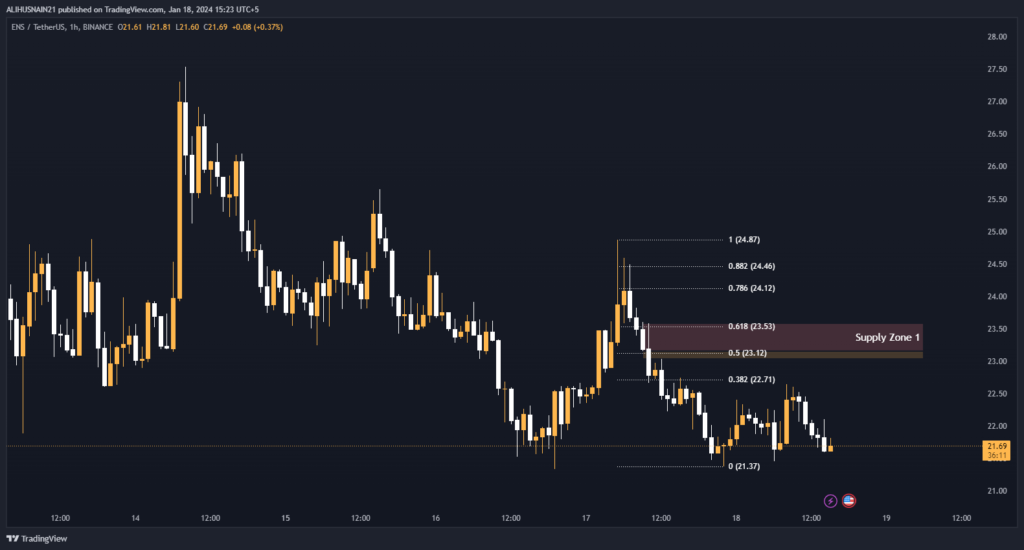
1 Hour Timeframe
Looking closer at the 1 hour chart, the price is finding resistance just below the 0.618 Fibonacci level at $23.53, forming a bearish FVG between $23.15-23.03. This signals near term downside following the breakdown of support if the gap is not filled.
However, support lies just below at the overlapping support zone 1 on the 4 hour timeframe. A breakdown below here could see a move towards demand zone 1 on the daily chart.