The 4-hour and 1-hour timeframes have delineated several levels of support and resistance that will likely determine the near-term direction of ENS USDT.
A hold above $21.04- $21.17 keeps the bullish medium-term structural outlook intact. But deeper pullbacks open the possibility of range-bound trading in the near-term.
Traders should watch the reaction around defined levels for trading opportunities.
4 Hour Timeframe
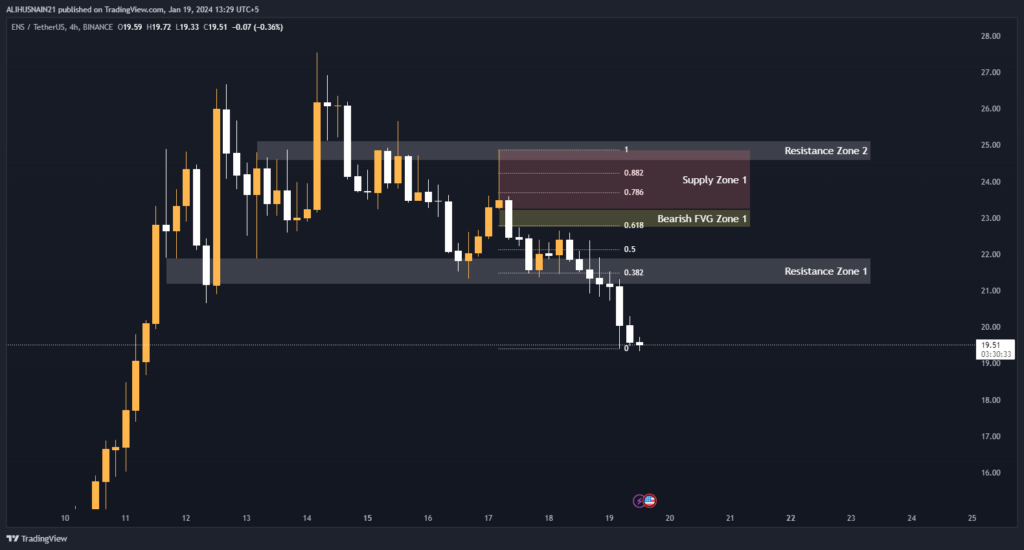
The 4-hour chart provides useful insight into the medium-term price trends and levels of support and resistance for ENS USDT. Currently, the price is finding resistance within the first resistance zone between $21.90- $21.17. A break above this level could see further upside to the next resistance zone between $25.12- $24.57.
Looking at the Fibonacci retracement levels, if the price shows signs of weakness we could see a pullback to the 0.618 level at $22.78. Deeper corrections may find support at the 0.50, 0.382 or 0.786 levels. A break below 0.786 at $23.70 would indicate the bullish momentum has weakened.
On the supply side, there is a high volume node defined by Supply Zone 1 between $24.87- $23.23. If reached, this area is likely to provide stiff resistance to further upwards movement. Below this, the bearish fair value gap (BFVG) between $23.23- $22.74 acts as an imbalance that may spark a sell-off if triggered.
Support and Resistance Levels
| S / R Type | High | Low |
| Resistance Zone 1 | 21.90 | 21.17 |
| Resistance Zone 2 | 25.12 | 24.57 |
Fibonacci Retracement Levels
| 0.382 | 21.50 |
| 0.50 | 22.14 |
| 0.618 | 22.78 |
| 0.786 | 23.70 |
| 0.882 | 24.22 |
Supply Zone
| Zone Number | High | Low |
| Supply Zone 1 | 24.87 | 23.23 |
Fair Value Gaps / Imbalances
| Gap Number | High | Low |
| Bearish FVG Zone 1 | 23.23 | 22.74 |
1 Hour Timeframe
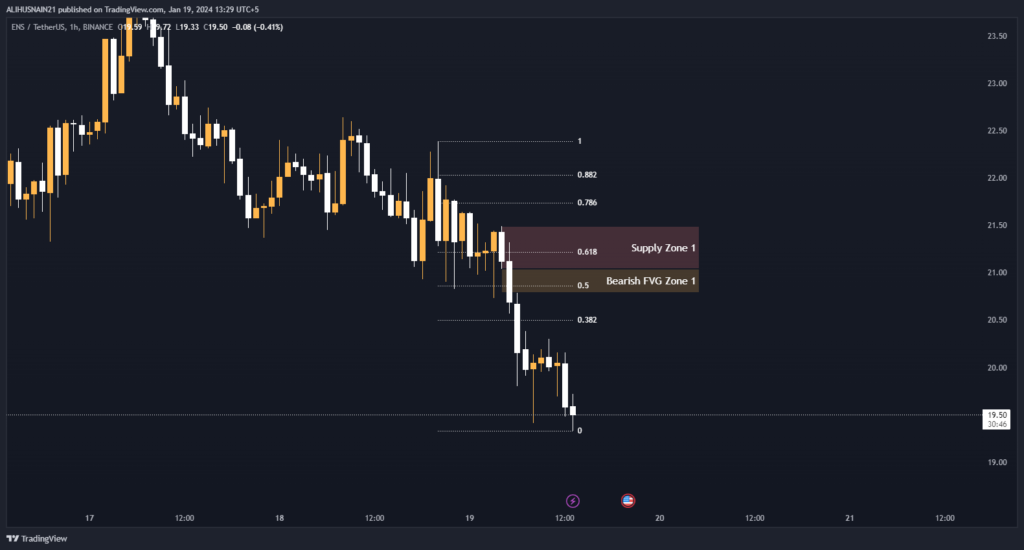
Zooming into the one-hour timeframe gives a better picture of short-term price dynamics and levels. The price is currently testing Supply Zone 1 defined by $21.49- $21.04 after rebounding from just above the 0.618 Fib level at $21.26.
A break below Supply Zone 1 and the BFVG zone between $21.04- $20.79 could potentially lead to accelerated downside towards support at the 0.50 and 0.382 Fib levels around $20.90 and $20.55 respectively. However, hold above these levels maintains the chance of a retest of the supply zone overhead.
Fibonacci Retracement Levels
| 0.382 | 20.55 |
| 0.50 | 20.90 |
| 0.618 | 21.26 |
| 0.786 | 21.75 |
| 0.882 | 22.04 |
Supply Zone
| Zone Number | High | Low |
| Supply Zone 1 | 21.49 | 21.04 |
Fair Value Gaps / Imbalances
| Gap Number | High | Low |
| Bearish FVG Zone 1 | 21.04 | 20.79 |