The technical picture on the 4hr and 1hr charts remains neutral to bearish for Ethereum Name Service (ENS USDT) in the near-term. Breakouts above $21.17/21.49 resistance or below $18 support will provide important clues on the next immediate direction.
Multiple Fib retracement, supply and FVG levels provide identifiable areas of interest for range-bound traders.
4 Hour Timeframe
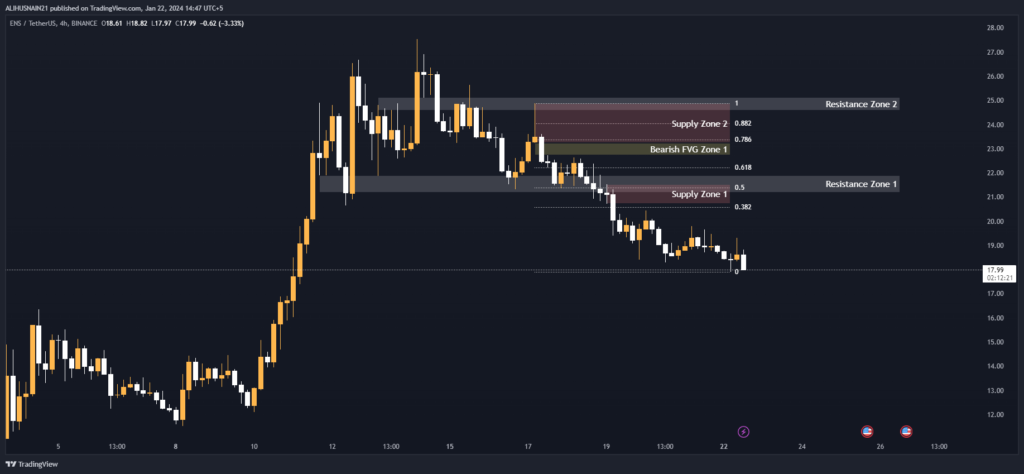
The 4 hour chart of ENS/USDT shows the crypto trading within a wide range over the past couple of weeks. There are several notable support and resistance levels that will be important to watch on longer timeframes:
Support and Resistance Zones
The first resistance zone sits between $21.90-$21.17. Breaking above this zone could see prices rise towards the next resistance level of $25.12-$24.57. On the downside, support lies at the recent lows around $17.
Fibonacci Retracement Levels
Fibonacci retracement levels provide indications of where prices may find support or resistance as they retrace moves. On the 4 hour chart, the 0.382, 0.50, 0.618, 0.786 and 0.882 Fibonacci retracement levels fall between $20.57-$24.05. These levels will likely attract buyers during any dips or provide selling pressure on rallies.
Supply Zones
Supply zones are areas where sellers are more abundant due to stops or profit taking orders clustering. ENS/USDT has formed two notable supply zones on the 4 hour chart – $21.52-$20.73 and $24.87-$23.23. These zones could see sellers step in and stall any upward moves.
Fair Value Gaps/Imbalances
A bearish fair value gap (FVG) sits between $23.23-$22.74. This indicates an imbalance caused by rapid downwards price action, with sellers remaining in control. Prices may struggle to move above and fill this gap in the short-term.
In summary, on the 4 hour chart the crypto appears to be finding some balance between $21-$18 support. A break above $21.17 resistance could see the next move upwards towards the supply zone at $24.87, with FVG resistance around $23.23 acting as an obstacle.
Support and Resistance Levels
| S / R Type | High | Low |
| Resistance Zone 1 | 21.90 | 21.17 |
| Resistance Zone 2 | 25.12 | 24.57 |
Fibonacci Retracement Levels
| 0.382 | 20.57 |
| 0.50 | 21.39 |
| 0.618 | 22.21 |
| 0.786 | 23.38 |
| 0.882 | 24.05 |
Supply Zone
| Zone Number | High | Low |
| Supply Zone 1 | 21.52 | 20.73 |
| Supply Zone 2 | 24.87 | 23.23 |
Fair Value Gaps / Imbalances
| Gap Number | High | Low |
| Bearish FVG Zone 1 | 23.23 | 22.74 |
1 Hour Timeframe
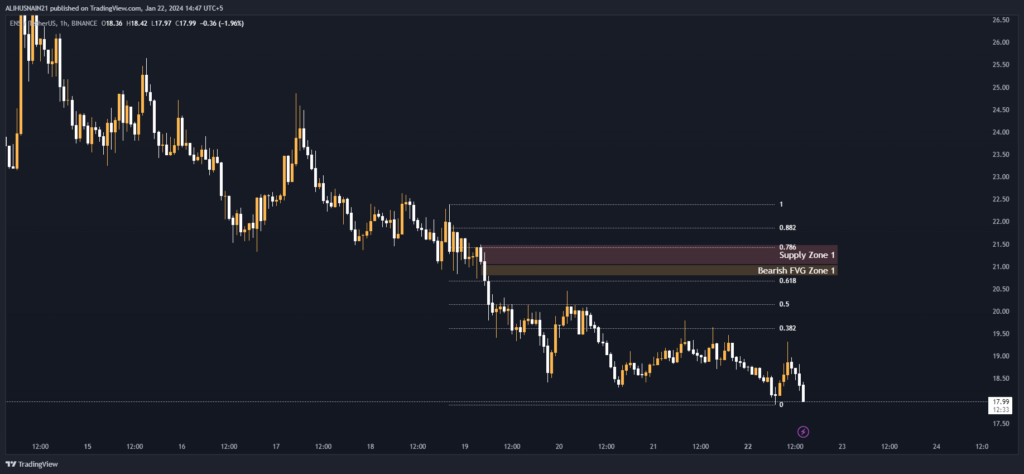
Zooming into the 1 hour chart provides a closer look at more immediate levels.
Fibonacci Retracement Levels
The 0.382, 0.50, 0.618, 0.786 and 0.882 Fibonacci retracement levels fall between $19.62-$21.86 on this timeframe. These levels may attract buyers on dips in the short-term.
Supply Zone
A narrow supply zone has formed between $21.49-$21.04. Sellers could step in to stall any upside momentum within this area.
Fair Value Gap
A bearish fair value gap sits just below between $21.04-$20.79. Prices may struggle to sustain moves above the lower boundary of this gap in the very near term.
Fibonacci Retracement Levels
| 0.382 | 19.62 |
| 0.50 | 20.15 |
| 0.618 | 20.68 |
| 0.786 | 21.43 |
| 0.882 | 21.86 |
Supply Zone
| Zone Number | High | Low |
| Supply Zone 1 | 21.49 | 21.04 |
Fair Value Gaps / Imbalances
| Gap Number | High | Low |
| Bearish FVG Zone 1 | 21.04 | 20.79 |
Near-Term Expectation
In the next 1-4 hours, if buyers can push ENS/USDT above $21.17 resistance and the 21.49 supply zone then we could see further upside back towards the 4hr supply zone around $24.87. However, a rejection at either level increases the risk of a retest of the $20.79 fair value gap and support around $18.
On the flip side, a break below the $18 support opens the door for a deeper pullback towards the next support at $17. Bulls will want to defend $18 to maintain an upward bias in the short-term.