The current price of Ethereum Name Service (ENS USDT) is 16.48 based on the charts. This technical analysis will evaluate the 4-hour and 1-hour timeframes to identify potential support, resistance, supply and demand zones that could impact short to medium term price movement.
The various support and resistance, supply and demand zones identified on the 4-hour and 1-hour timeframes provide traders with potential areas of interest for entering and exiting positions over the short to medium term.
Continued monitoring of price action relative to these technical levels will be important for determining subsequent ENS/USDT direction.
4 Hour Timeframe
Support and Resistance Levels
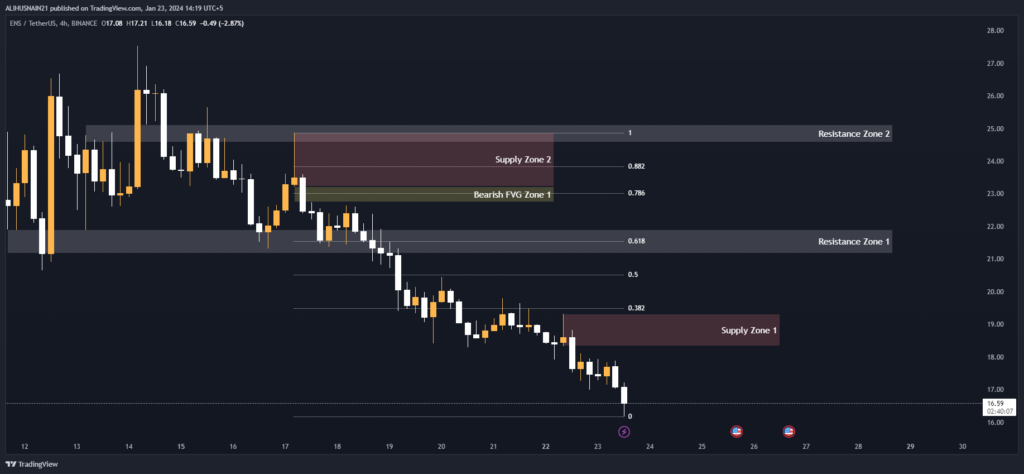
There are two key resistance zones to watch on the 4-hour chart. Resistance Zone 1 between 21.90-21.17 would need to be broken for prices to continue higher. A move above Resistance Zone 2 from 25.12-24.57 could indicate even stronger upside momentum. On the downside, the 21 period exponential moving average (EMA) at 15.90 provides short term support.
| S / R Type | High | Low |
| Resistance Zone 1 | 21.90 | 21.17 |
| Resistance Zone 2 | 25.12 | 24.57 |
Fibonacci Retracement Levels
Evaluating the recent swing high to low, the 0.50 and 0.618 Fibonacci retracement levels from 20.53-21.54 respectively could act as resistance if prices rise. Support lies at the 0.382 level of 19.51. A break below here could see a move down to test the 0.786 and 0.882 levels at 23.01 and 23.85.
| 0.382 | 19.51 |
| 0.50 | 20.53 |
| 0.618 | 21.54 |
| 0.786 | 23.01 |
| 0.882 | 23.85 |
Supply Zone
There are two supply zones where sellers may emerge on rallies. Supply Zone 1 from 19.32-18.33 and Supply Zone 2 spanning 24.87-23.23 could cap upside momentum.
| Zone Number | High | Low |
| Supply Zone 1 | 19.32 | 18.33 |
| Supply Zone 2 | 24.87 | 23.23 |
Fair Value Gaps / Imbalances
The bearish fair value gap (FVG) zone between 23.23-22.74 showed an area of order imbalances during a recent down move. This zone may now act as resistance on pullbacks
| Gap Number | High | Low |
| Bearish FVG Zone 1 | 23.23 | 22.74 |
1 Hour Timeframe
Fibonacci Retracement Levels
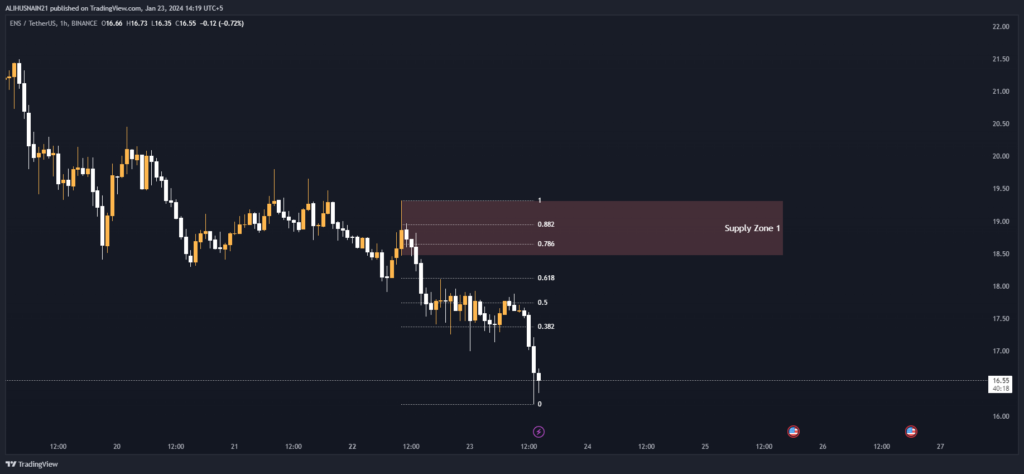
On the 1-hour chart, the 0.382 level provides nearest resistance at 17.38. The 0.50 and 0.618 levels from 17.75-18.11 respectively would need to be crossed to maintain upside momentum in the near term according to Fibonacci theory.
| 0.382 | 17.38 |
| 0.50 | 17.75 |
| 0.618 | 18.11 |
| 0.786 | 18.66 |
| 0.882 | 18.95 |
Supply Zone
Supply Zone 1 ranging from 19.32-18.47 could stall rallies on the 1-hour timeframe given seller concentrations within this price range.
| Zone Number | High | Low |
| Supply Zone 1 | 19.32 | 18.47 |
Based on the technical analysis, traders may look to enter long positions on a break above Supply Zone 1 on the 4-hour chart around 19.32 with a tight stop loss placed under the 21 EMA. Upside price targets initially lie at Resistance Zone 1 and the 0.5-0.618 Fibonacci cluster.
Short term traders may wait for a break above the 1-hour Supply Zone 1 and 0.382 Fibonacci level at 17.38 before entering long trades. Profit taking could then be considered at Resistance Zone 1 on the 4-hour timeframe.
Should prices turn bearish, traders may look to short on breaks below identified support levels like the 21 EMA and 0.382 Fibonacci level, targeting the subsequent supply and demand zones. Overall, a break of either Resistance Zone 1 or 2 on the 4-hour chart could signal the next major trend direction.