The 4-hour chart of ENS USDT shows the potential for further upside towards Resistance Zones 1 & 2 if $21.90 – $21.17 is cleared. Support lies at Fib levels and Supply Zone 1. A close above $23.23 could confirm an upside break on the longer timeframe.
Near term, dip buys may be found in the 1-hour demand zone with bullish FVG fill seen as the next upside target. Overall, the technicals point to potential further upside potential in the coming sessions.
In this technical analysis, I will be analyzing the 4-hour and 1-hour charts of ENS USDT to identify any potential trading opportunities over the short to medium term. Let’s get started.
4 Hour Timeframe Analysis
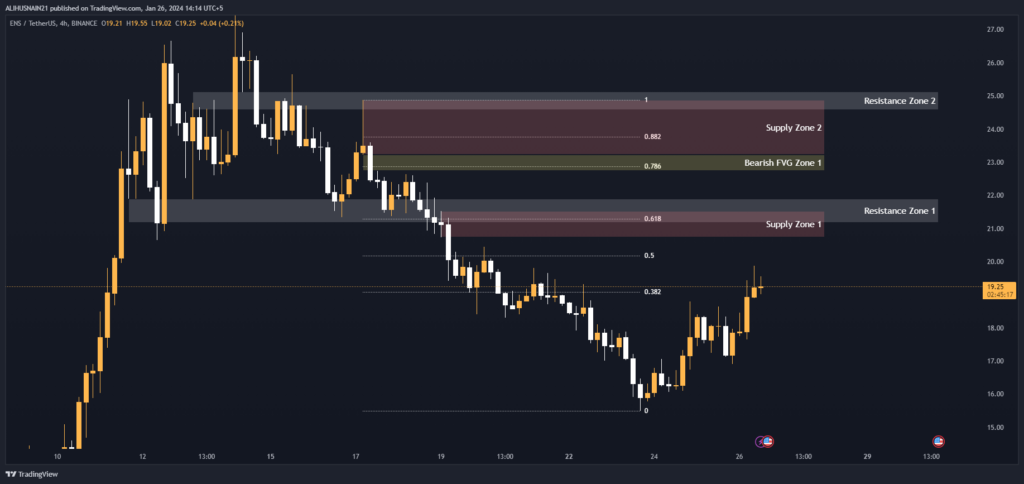
Based on the 4-hour analysis, the key levels to watch are Resistance Zones 1 & 2 near $21.90 – $21.17 and $25.12 – $24.57 respectively.
Support lies at the Fib levels near $20.18 and $21.28 along with Supply Zone 1 from $21.52 – $20.73. A close above $23.23 could fill the bearish FVG and confirm an upside break.
Support and Resistance Levels
Looking at the 4-hour chart, we can identify two key resistance zones and one supply zone:
- Resistance Zone 1: $21.90 – $21.17
- Resistance Zone 2: $25.12 – $24.57
- Supply Zone 1: $21.52 – $20.73
If price is able to push above Resistance Zone 1, this would be a bullish signal and could see further upside towards Zone 2. However, there is stiff resistance in this area so a rejection is also possible.
| S / R Type | High | Low |
| Resistance Zone 1 | 21.90 | 21.17 |
| Resistance Zone 2 | 25.12 | 24.57 |
Fibonacci Retracement Levels
Applying Fibonacci retracement levels from the recent high of $25.12 to the low of $19.08, we get the following key levels:
- 0.382 Fib: $19.08
- 0.50 Fib: $20.18
- 0.618 Fib: $21.28
- 0.786 Fib: $22.87
- 0.882 Fib: $23.77
The 0.50 and 0.618 Fib levels near $20.18 and $21.28 respectively provide areas of support on any pullbacks. A break below the 0.382 Fib at $19.08 would indicate further downside is likely.
| 0.382 | 19.08 |
| 0.50 | 20.18 |
| 0.618 | 21.28 |
| 0.786 | 22.87 |
| 0.882 | 23.77 |
Supply Zone
| Zone Number | High | Low |
| Supply Zone 1 | 21.52 | 20.73 |
| Supply Zone 2 | 24.87 | 23.23 |
Fair Value Gaps / Imbalances
There is one bearish fair value gap (FVG) between $23.23 – $22.74. FVGs typically act as magnets and price will often return to fill these gaps. A close above $23.23 could signal the start of a new uptrend.
| Gap Number | High | Low |
| Bearish FVG Zone 1 | 23.23 | 22.74 |
1 Hour Timeframe Analysis
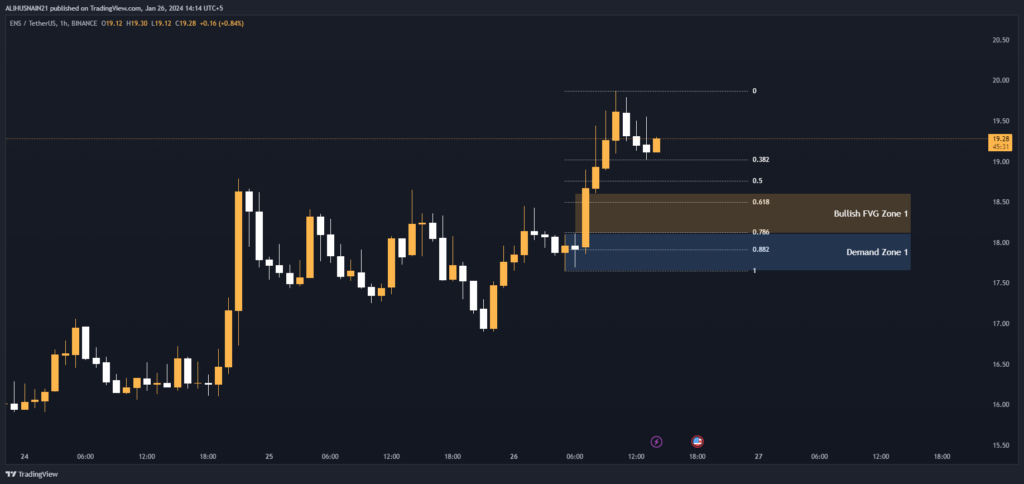
On the 1-hour chart, traders will be watching the demand zone between $18.11 – $17.65 for potential dip buys.
Upside momentum could see a retest of the 0.382 Fib at $19.02 or a push higher to fill the bullish FVG near $18.61.
Support and Resistance Levels
On the tighter 1-hour timeframe, support and resistance levels have not clearly defined yet. Price action would need to consolidate more to create new levels.
Fibonacci Retracement Levels
The 1-hour Fibonacci levels from the $19.02 high to the $18.76 low are:
- 0.382 Fib: $19.02
- 0.50 Fib: $18.76
- 0.618 Fib: $18.50
- 0.786 Fib: $18.13
- 0.882 Fib: $17.91
| 0.382 | 19.02 |
| 0.50 | 18.76 |
| 0.618 | 18.50 |
| 0.786 | 18.13 |
| 0.882 | 17.91 |
Demand Zone
There is one demand zone forming between $18.11 – $17.65 based on recent buying activity and support holds in this area.
| Zone Number | High | Low |
| Demand Zone 1 | 18.11 | 17.65 |
Fair Value Gaps / Imbalances
A bullish FVG has formed between $18.61 – $18.11. As mentioned earlier, FVGs tend to act as magnets and price will often return to fill these gaps.
| Gap Number | High | Low |
| Bullish FVG Zone 1 | 18.61 | 18.11 |