The current price of ENS USDT is $19.34. In the 4-hour chart, the price is trading between the 0.382 Fibonacci retracement level of $19.08 and the 50% retracement level of $20.19. This indicates that ENS USDT is in a consolidation phase after the recent uptrend.
ENS USDT is in a consolidation phase in the mid-$19 region after retreating from resistance. A break above $19.15 could signal a continuation of the uptrend towards $20 initially.
Support lies at clustered Fibonacci levels and demand zone between $17.65–$19.08. A breakdown there could see further weakness ahead.
Traders may look for opportunities both ways while volatility subsides.
4 Hour Timeframe Analysis
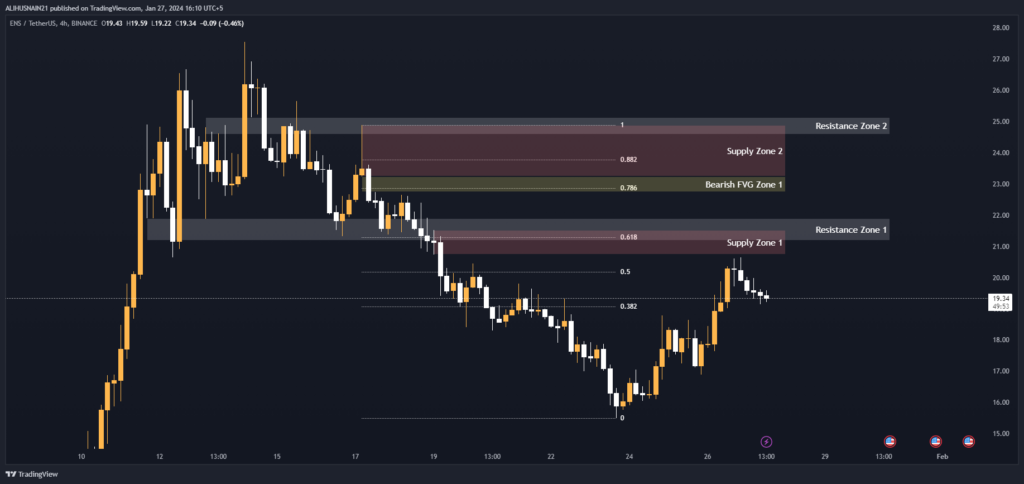
In the 4-hour chart, ENS USDT formed higher highs and higher lows in its recent uptrend, rising from $15 to over $21. However, selling pressure emerged at the resistance zone between $21.17–$21.90, causing the price to retrace.
There are now two resistance zones above at $21.17–$21.90 and $25.12–$24.57 that need to be overcome for the uptrend to resume.
Immediate support lies at the 0.382, 0.50, and 0.618 Fibonacci retracement levels between $19.08–$21.28. Below that, supply zone 1 from $20.73–$21.52 could provide support as well.
A break below $20 would indicate further weakness towards supply zone 2 at $23.23–$24.87.
Support and Resistance Levels
| S / R Type | High | Low |
| Resistance Zone 1 | 21.90 | 21.17 |
| Resistance Zone 2 | 25.12 | 24.57 |
Fibonacci Retracement Levels
| 0.382 | 19.08 |
| 0.50 | 20.19 |
| 0.618 | 21.28 |
| 0.786 | 22.86 |
| 0.882 | 23.76 |
Supply Zone
| Zone Number | High | Low |
| Supply Zone 1 | 21.52 | 20.73 |
| Supply Zone 2 | 24.87 | 23.23 |
Fair Value Gaps / Imbalances
| Gap Number | High | Low |
| Bearish FVG Zone 1 | 23.23 | 22.74 |
1 Hour Timeframe Analysis
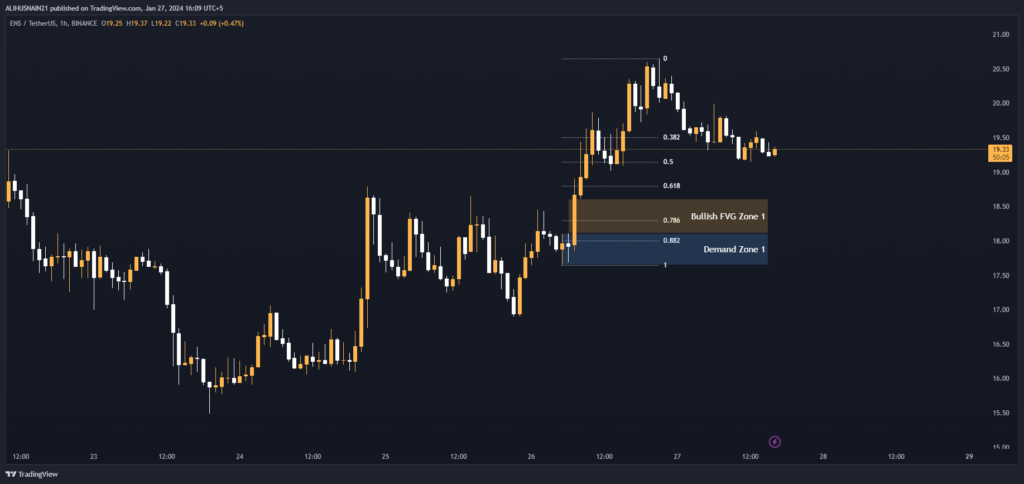
Zooming into the 1-hour chart, we can see that ENS USDT is consolidating between the 0.382 support of $19.50 and the 50% resistance of $19.15.
Demand zone 1 from $17.65–$18.11 coincides with the bullish fair value gap (FVG) between $18.11–$18.61. This area could attract buying interest and lead to a bounce.
However, a breakdown below $17.65 in demand zone 1 would open the door for a steeper fall towards the 0.618, 0.786 and 0.882 Fibonacci retracement levels between $18.79–$18.00.
Fibonacci Retracement Levels
| 0.382 | 19.50 |
| 0.50 | 19.15 |
| 0.618 | 18.79 |
| 0.786 | 18.28 |
| 0.882 | 18.00 |
Demand Zone
| Zone Number | High | Low |
| Demand Zone 1 | 18.11 | 17.65 |
Fair Value Gaps / Imbalances
| Gap Number | High | Low |
| Bullish FVG Zone 1 | 18.61 | 18.11 |
Traders could look to go long on ENS USDT above $19.15 in the 1-hour chart. This move would indicate that buyers are back in control.
Stop loss could be placed below the demand zone at $17.65. Upside targets are the 50% resistance at $19.15 as the first target, followed by $20 in the 4-hour chart as the price consolidates between support and resistance.
Positions could also be adjusted using the indicated Fibonacci levels and bands on further upswings.