Based on the analysis of ENS USDT, I would say the short term outlook remains bullish as long as we hold above $18.26 support. The first target is a move back up to challenge resistance in the $19.80 – $20.17 zone.
A daily close above here could trigger more upside momentum towards $20.50 initially. However, a breakdown of support below $18.26-18.15 could undermine the near term positive structure and potentially lead to a retest of the next demand zone around $17.90.
1 Hour Timeframe
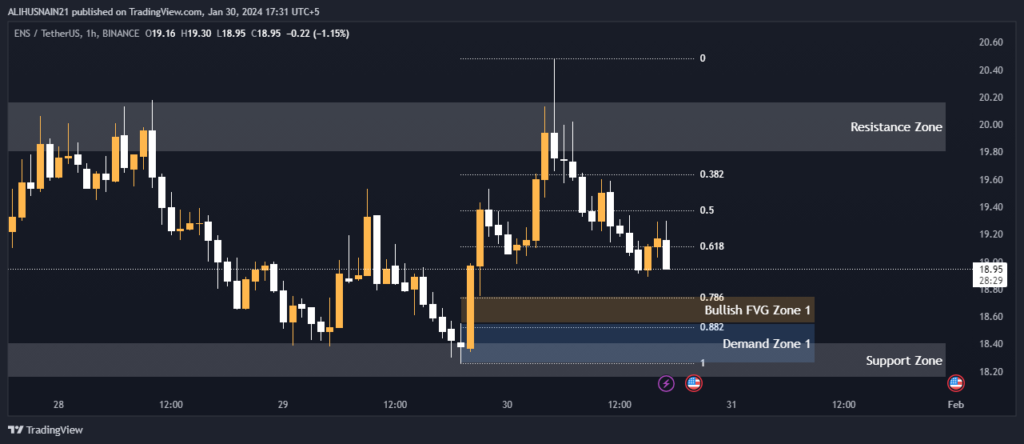
The current market price of ENS USDT is trading at $19.21 based on the 1 hour timeframe. As we can see from the summary table provided, there is an established support zone between $18.41 – $18.15.
This is a key area that buyers may look to defend to maintain the short term uptrend. Above the current market price we have immediate resistance at $20.17 – $19.80 which needs to be broken for the uptrend to continue higher.
Support and Resistance Levels
| S / R Type | High | Low |
| Support Zone | 18.41 | 18.15 |
| Resistance Zone | 20.17 | 19.80 |
Fibonacci Retracement Levels
Retracement levels provide potential pullback targets for buyers to enter back into long positions. The 38.2% Fibonacci retracement level is found at $19.64 and will be an important level to watch on any minor downward moves.
Below this we have support at the 50% level of $19.37 then the 61.8% level at $19.11. A breakdown below $18.74 (78.6% level) could signify a longer term trend change to the downside.
| 0.382 | 19.64 |
| 0.50 | 19.37 |
| 0.618 | 19.11 |
| 0.786 | 18.74 |
| 0.882 | 18.52 |
Demand Zone
Confluence with Support Looking left on the chart we can see demand zone 1 established between $18.55 – $18.26 acting as a confluence area of support with the lower bound of the first support zone mentioned.
This area near $18.26 should attract buyers on weakness and potentially halt any further declines.
| Zone Number | High | Low |
| Demand Zone 1 | 18.55 | 18.26 |
Fair Value Gaps / Imbalances
Above the current market price of ENS USDT we see an bullish fair value gap established between $18.75 – $18.55 according to volume profile.
It is constructive to see price respecting this area to the upside already, potentially leading buyers to defend it going forward and add to long positions on further dips.
| Gap Number | High | Low |
| Bullish FVG Zone 1 | 18.75 | 18.55 |
Overall, traders may look to buy ENS USDT on minor dips respecting support/demand zones and Fibonacci retracement levels for potential long trades. Upside breakouts and volume profiles will be important to watch.