We see establishing demand and supply zones across timeframes. Price will need to break above weekly resistance and daily supply zone for an upside move, while holds of support signal further range trading ahead.
Weekly Timeframe
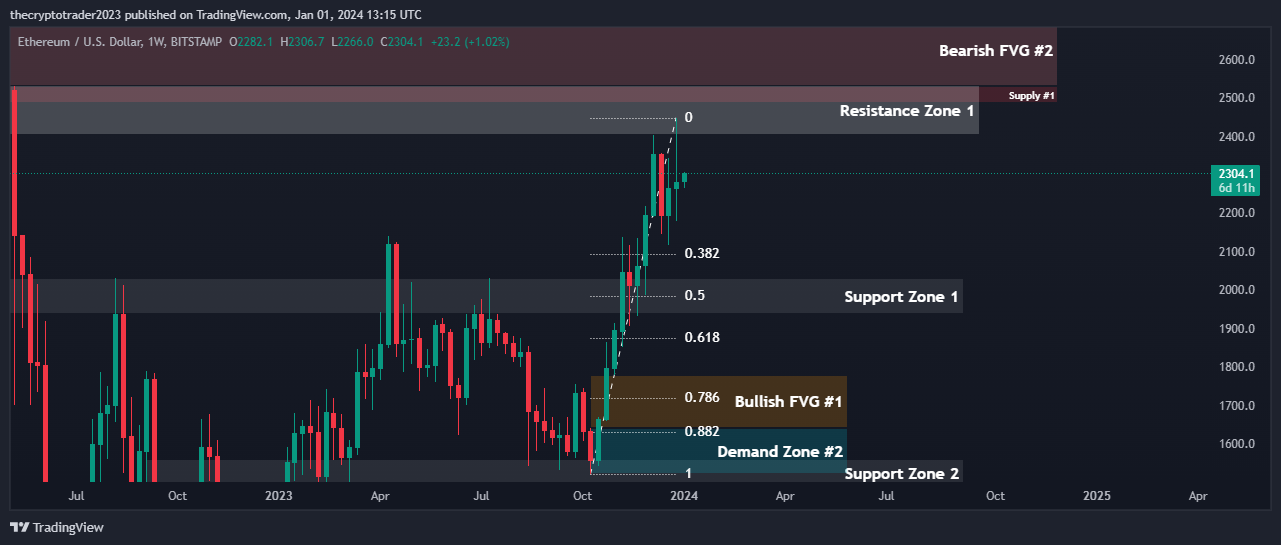
- ETH/USDT is currently trading within a weekly support zone between $1936.4-$2031.06.
- The nearest resistance zone is between $2403.1-$2531.9.
- We see a supply zone formed above between $2485-$2529 which could act as resistance.
- A demand zone has been established between $1520.5-$1639.5 which could provide support.
- There are two fair value gaps, one above between $2529-$2716.8 and one below between $1639.5-$1778.7.
Support and Resistance Levels
| S/R Type | High | Low |
| Support Zone #1 | 2031.06 | 1936.4 |
| Suport Zone #2 | 1558.9 | 1487.2 |
| Resistance Zone#1 | 2531.9 | 2403.1 |
Fibonacci Retracement Levels
| 0.382 | 2092.8 |
| 0.50 | 1983.5 |
| 0.618 | 1874.2 |
| 0.786 | 1718.7 |
| 0.882 | 1628.9 |
Supply Zone
| Zone Number | High | Low |
| Suppy Zone #1 | 2529.0 | 2485.0 |
Demand Zone
| Zone Number | High | Low |
| Demand Zone #1 | 1639.5 | 1520.5 |
Fair Value Gaps / Imbalances
| Gap Number | High | Low |
| FVG #1 | 1778.7 | 1639.5 |
| FVG #2 | 2716.8 | 2529.0 |
Daily Timeframe
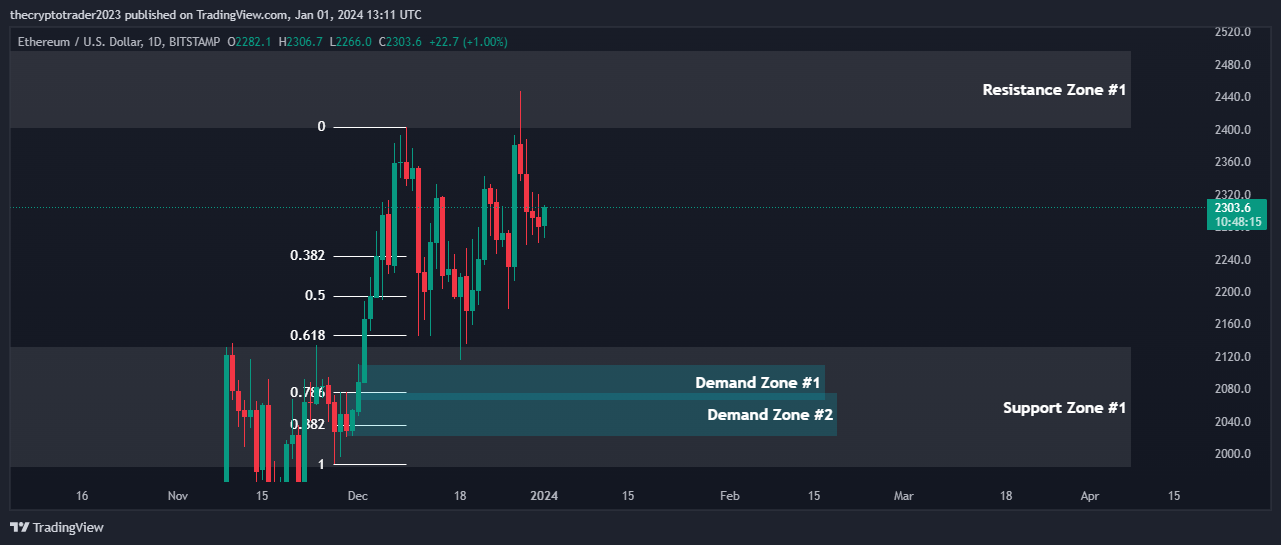
- Price is finding support around the $1982.6-$2133 zone.
- Resistance lies at $2399.7-$2497.4 zone.
- Demand zones have been identified at $2065.1-$2110.7 and $2020.6-$2075.7.
Support and Resistance Levels
| S/R Type | High | Low |
| Support Zone #1 | 2133.0 | 1982.6 |
| Resistance Zone #1 | 2497.4 | 2399.7 |
Fibonacci Retracement Levels
| 0.382 | 2243.3 |
| 0.50 | 2194.4 |
| 0.618 | 2145.4 |
| 0.786 | 2075.5 |
| 0.882 | 2035.4 |
Demand Zone
| Zone Number | High | Low |
| Demand Zone #1 | 2110.7 | 2065.1 |
| Demand Zone #2 | 2075.7 | 2020.6 |
4 Hour Timeframe
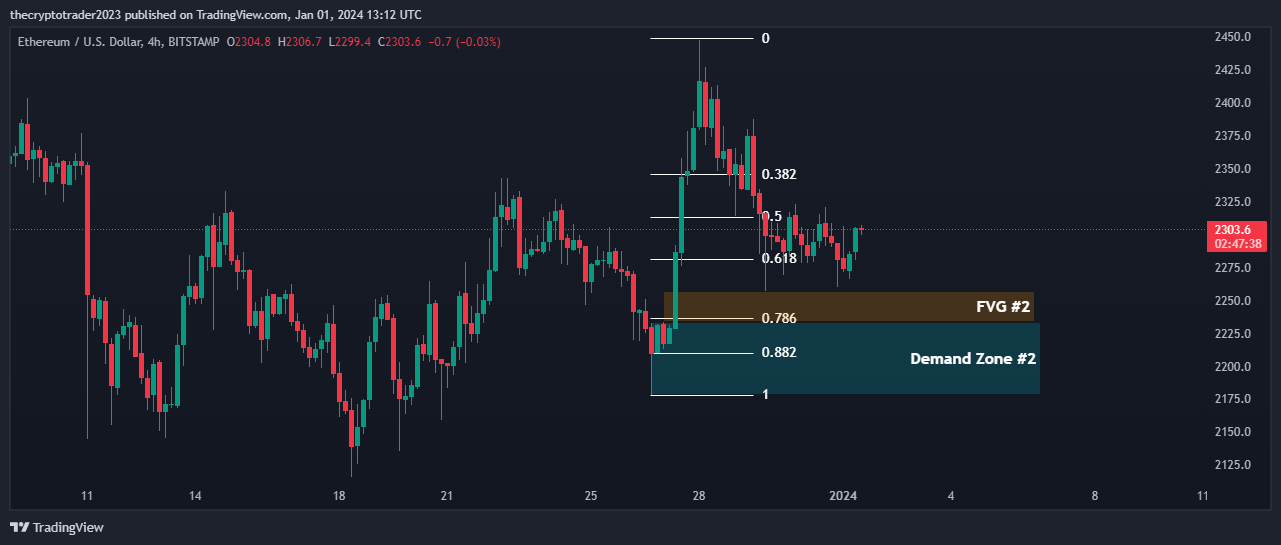
- Key support lies at the $2133-$1982.6 weekly zone according to the higher timeframe.
- Fibonacci retracement suggests potential bounce zones between $2209.8-$2243.3.
- A demand zone has formed between $2178.2-$2233.5.
Fibonacci Retracement Levels
| 0.382 | 2345.2 |
| 0.50 | 2313.5 |
| 0.618 | 2313.5 |
| 0.786 | 2235.7 |
| 0.882 | 2209.8 |
Demand Zone
| Zone Number | High | Low |
| Demand Zone #1 | 2233.5 | 2178.2 |
Fair Value Gaps / Imbalances
| Gap Number | High | Low |
| FVG #1 | 2257.2 | 2233.5 |
1 Hour Timeframe
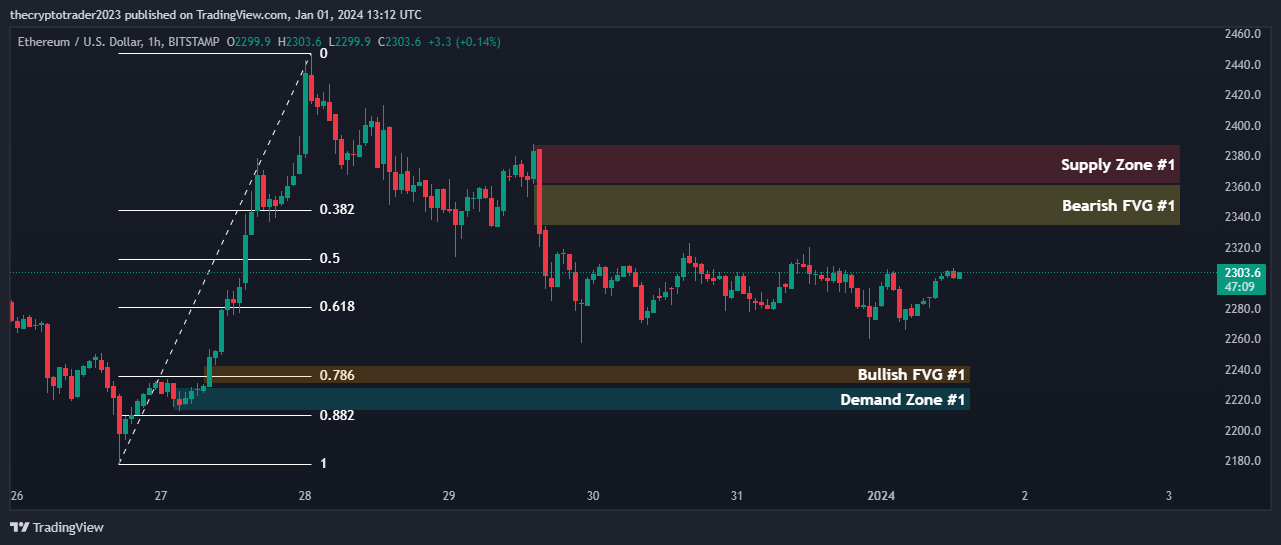
- A supply zone has formed between $2361.5-$2387.6.
- Demand zone exists from $2212.8-$2228.2.
- Potential bullish and bearish fair value gaps between $2230.5-$2242.9 and $2334.3-$2361.5 respectively.
Fibonacci Retracement Levels
| 0.382 | 2344.3 |
| 0.50 | 2312.6 |
| 0.618 | 2280.8 |
| 0.786 | 2236.0 |
| 0.882 | 2210.0 |
Supply Zone
| Zone Number | High | Low |
| Supply Zone #1 | 2387.6 | 2361.5 |
Demand Zone
| Zone Number | High | Low |
| Demand Zone #1 | 2228.2 | 2212.8 |
Fair Value Gaps / Imbalances
| Gap Number | High | Low |
| Bearish FVG #1 | 2361.5 | 2334.3 |
| Bullish FVG #1 | 2242.9 | 2230.5 |