Based on the technical indicators on both 4-hour and 1-hour charts, ETH USDT is facing resistance in the short term. Upside seems limited until the overhead supply zones and fair value gaps are taken out.
Support zone 1’s breach could see prices retest the lower range of supply zone 1 or extend losses. Traders may look to sell on rallies targeting the identified support levels.
4 Hour Timeframe
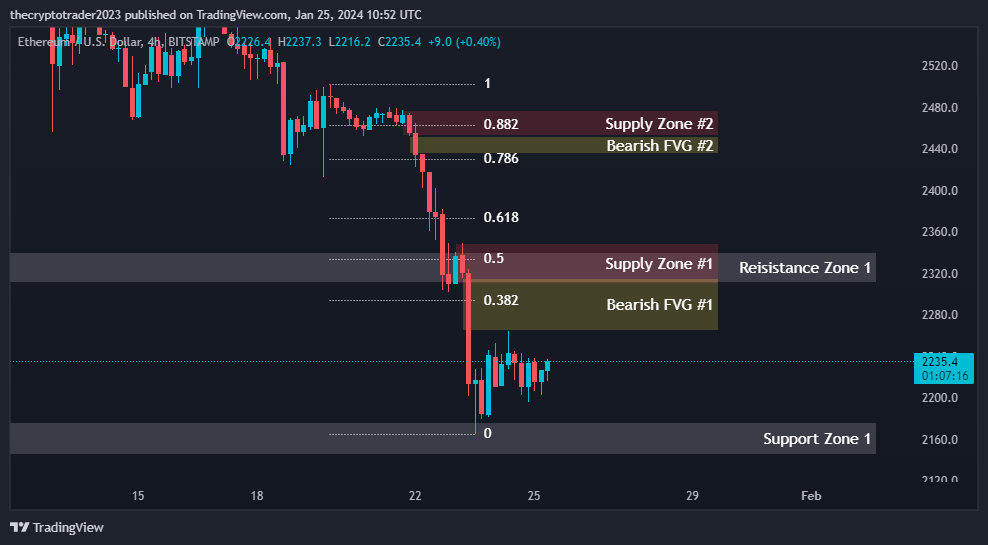
The 4-hour chart shows the current price of Ethereum (ETH USDT) at $2233.9 is positioned between the key support zone 1 of $2176.3-$2145 and resistance zone 2 of $2340.7-$2310.4. This suggests ETH USDT is in an equilibrium zone and range bound in the near term.
Support and Resistance Levels
Looking at the support and resistance levels can provide clues about the likely near term price direction. The close proximity of the current price to resistance zone 2 increases the probability of a downside break in the short term.
| S / R Type | High | Low |
| Support Zone 1 | 2176.3 | 2145.0 |
| Resistance Zone 2 | 2340.7 | 2310.4 |
Fibonacci Retracement Levels
The 0.382, 0.50 and 0.618 Fibonacci retracement levels stand at $2294, $2333.4 and $2373.9 respectively and will act as resistance on any upside move. This area from $2294-$2373.9 will be the target for sellers if resistance zone 2 is breached.
| 0.382 | 2294.0 |
| 0.50 | 2333.4 |
| 0.618 | 2373.9 |
| 0.786 | 2430.2 |
| 0.882 | 2462.7 |
Supply Zone
Supply zones 1 and 2 are formed based on multiple touches at $2309.7-$2348.8 and $2452-$2477 indicating areas of heavy selling pressure. A break below support zone 1 may see prices decline further towards the upper range of supply zone 1.
| Zone Number | High | Low |
| Supply Zone 1 | 2348.8 | 2309.7 |
| Supply Zone 2 | 2477.0 | 2452.0 |
Fair Value Gaps / Imbalances
The bearish fair value gaps at $2264.2-$2315.2 and $2435.3-$2452 also signal potential upside barriers. Prices are likely to face resistance within these ranges in case of an upward move.
| Gap Number | High | Low |
| Bearish FVG 1 | 2315.2 | 2264.2 |
| Bearish FVG 2 | 2452.0 | 2435.3 |
1 Hour Timeframe
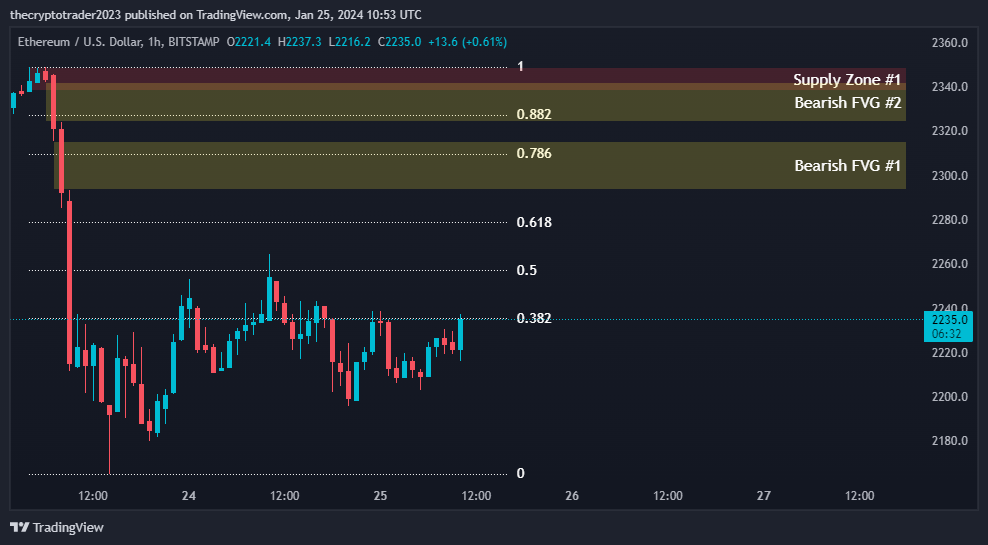
On the 1-hour chart, the recent price action has been largely range bound between the support at $2235.5 provided by the 0.382 Fibonacci retracement level and supply zone 1’s resistance between $2337.9-$2348.8.
Fibonacci Retracement Levels
The 0.382, 0.50 and 0.618 Fibonacci retracement levels provide upside pivots at $2235.5, $2257.1 and $2278.6 respectively. Whereas the 0.786 and 0.882 levels at $2309.4 and $2327.3 act as resistance.
| 0.382 | 2235.5 |
| 0.50 | 2257.1 |
| 0.618 | 2278.6 |
| 0.786 | 2309.4 |
| 0.882 | 2327.3 |
Supply Zone
Supply zone 1 from $2337.9-$2348.8 has been capping up moves, signaling selling pressure. Its breach could extend the short term rally towards resistance zone 2’s range of $2310.4-$2340.7.
| Zone Number | High | Low |
| Supply Zone 1 | 2348.8 | 2337.9 |
Fair Value Gaps / Imbalances
The bearish fair value gaps between $2293.1-$2315.2 and $2323.9-$2341.8 will likely slowdown upticks. Unless prices can advance and close decisively above these levels, near term bias remains tilted to the downside.
| Gap Number | High | Low |
| Bearish FVG 1 | 2315.2 | 2293.1 |
| Bearish FVG 2 | 2341.8 | 2323.9 |