Hello Traders and welcome back another technical analysis of ETH USDT. This month has been so generous and thanksgiving we have seen the crypto market moving like the bullrun of 2021.
But be cautious and practical. Do not just hop on to your phones and start trading any coin on any price levels, I am here to give you updates on a daily basis. So let’s get started with the technical analysis of Ethereum (ETH USDT).
Weekly Timeframe
Waheed’s Analysis
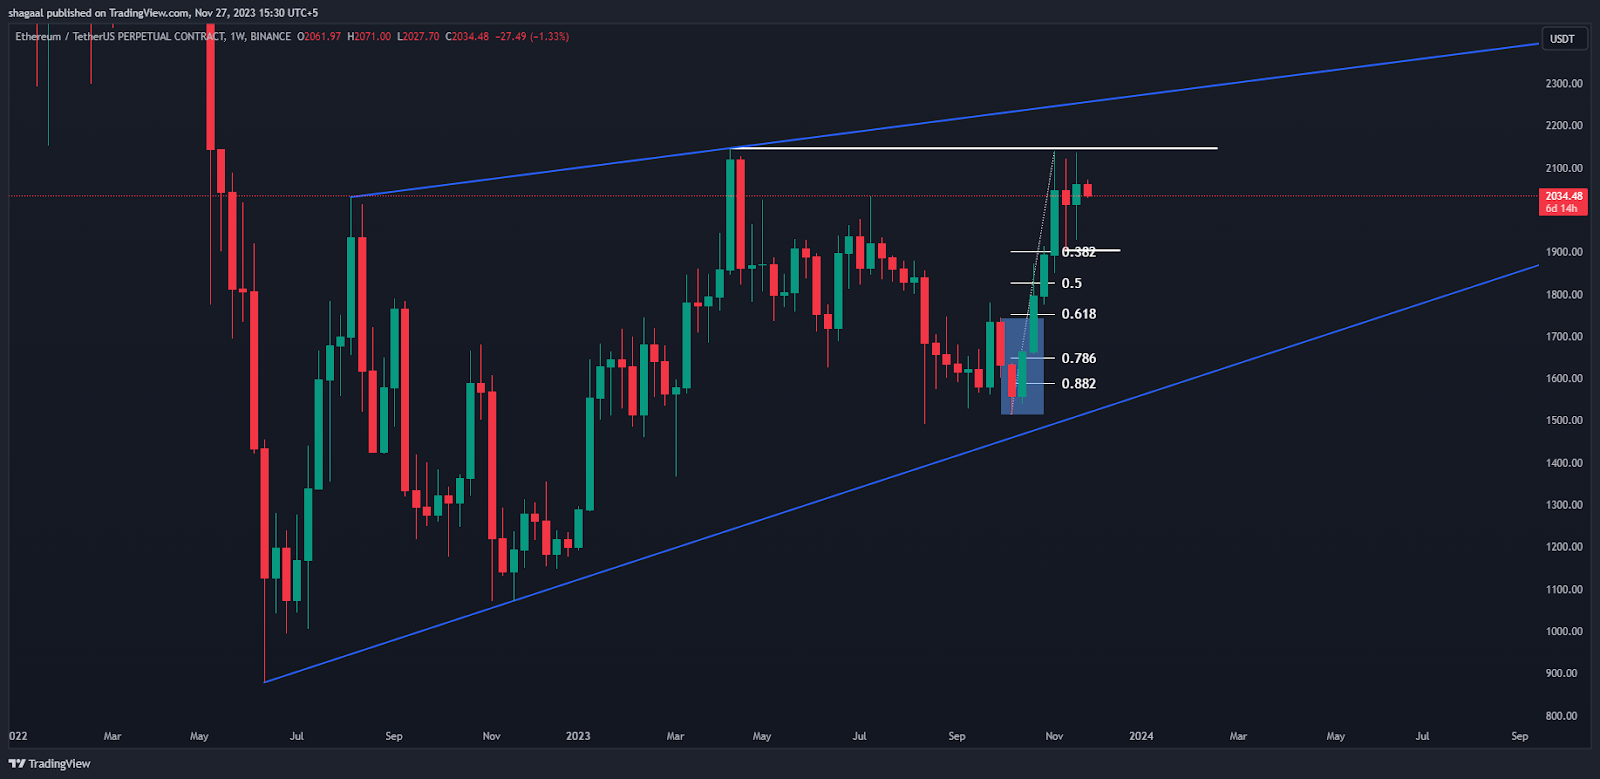
Ethereum on the weekly timeframe is at the resistance level 2120.98 which is trying to break but after 4 weeks it is unable to break it. We can see a pull back on the weekly timeframe as ETH USDT has already been aggressive with the movement to the upside.
The retracement levels are shown on the chart and fibonacci retracement table below for your reference and use in the trading.
The key levels for ETH USDT are shown below.
Support and Resistance Levels
Support
1679.62, 1939.13
Resistance
2120.00
Fibonacci Retracement Levels
0.382
1899.81
0.50
1823.79
0.618
1753.01
0.786
1648.16
0.882
1590.49
Supply Zone
Zone Number
High
Low
First Zone
3579.20
3210.33
Demand Zone
Zone Number
High
Low
First Zone
1744.54
1515.58
Fair Value Gaps / Imbalances
Gap Number
High
Low
Bullish Gap
1778.75
1668.22
Bearish Gap
2720.23
2147.95
Daily Timeframe
Waheed’s Analysis
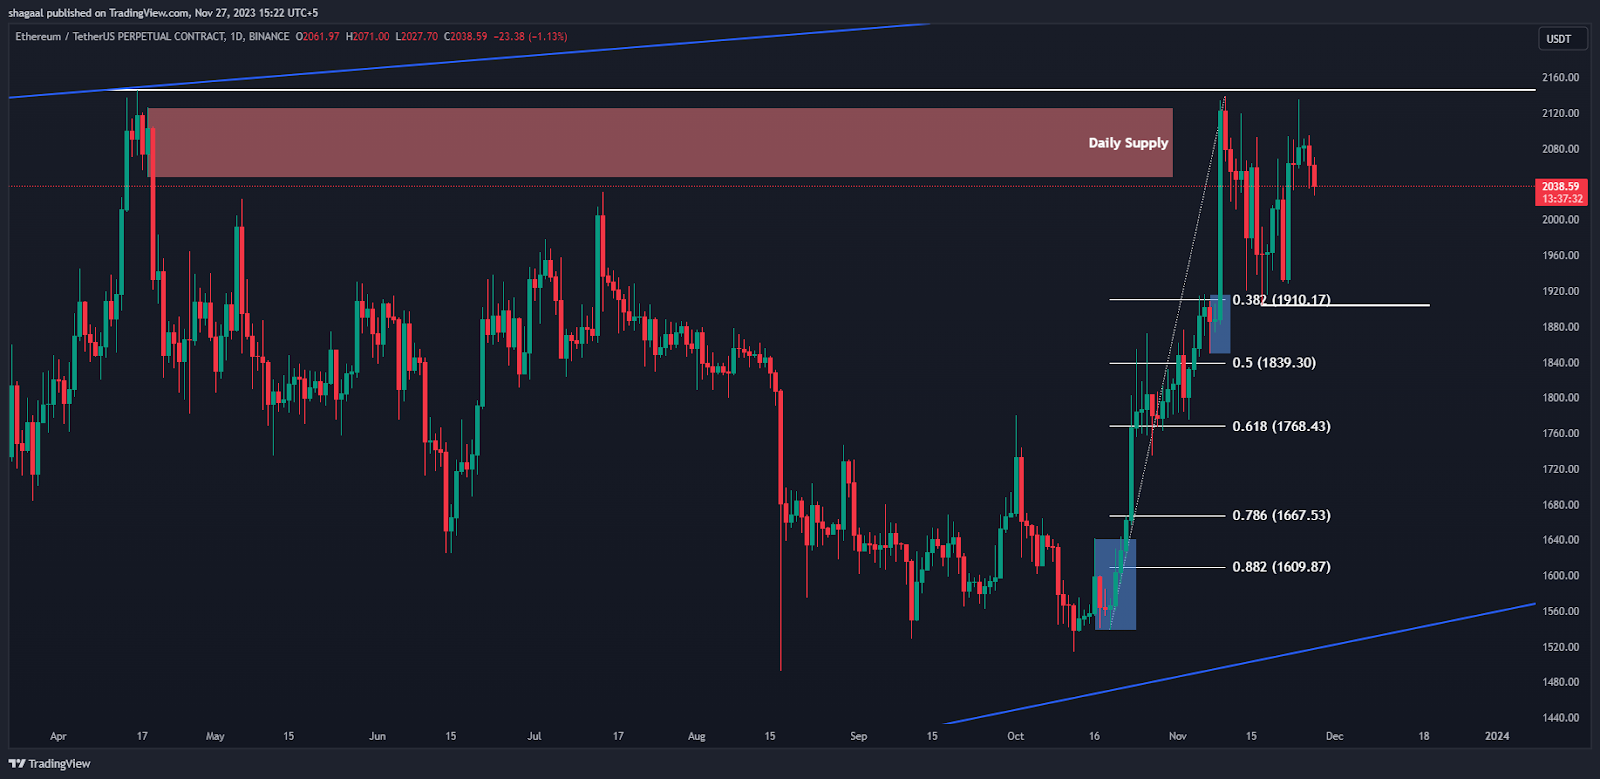
Ethereum on a daily time frame has aggressively moved upside leaving behind massive fair value gaps (imbalances) and mostly the price action tries to fill those gaps any time in the life span of the asset. I agree we are bullish on ETH USDT and it is clearly showing on the charts as well.
Currently while writing this post Ethereum has touched and grabbed orders from a supply zone which you can see on the chart. It was an aggressive move to the downside and then upside but currently range bound.
The retracement levels are shown on the chart and as well as on the Fibonacci Retracement table below, you can use this reference if and when ETH USDT pull backs and you have the levels to take the position.
Support and Resistance Levels
Support
1931.47, 1727.95, 1545.73
Resistance
2127.89
Fibonacci Retracement Levels
0.382
1910.89
0.50
1837.56
0.618
1767.36
0.786
1665.95
0.882
1609.79
Supply Zone
Zone Number
High
Low
First Zone
2973.23
2772.40
Second Zone
3584.45
3392.35
Demand Zone
Zone Number
High
Low
First Zone
1907.86
1849.13
Second Zone
1640.16
1537.78
Fair Value Gaps / Imbalances
Gap Number
High
Low
Bullish Gap
1846.92
1836.00
Bullish Gap
1736.16
1642.55
Bullish Gap
1591.07
1575.47
4 Hour Timeframe
Waheed’s Analysis
In the 4 hour timeframe the ETH USDT is range bound, range high at 2120.14 and range low at 1932.91. Currently the 4 hour timeframe is retracing since there was a huge break to the upside, it needs to cool down and gradually move up which is a good sign of market strength.
The retracement levels for Ethereum are shown below in the Fibonacci Retracement table, you can check them. The area where I am happy to take a position is 0.618, 0.786 and 0.882.
The demand zone and the supply zones are marked with the Blue and Red rectangles respectively and tables below contain the prices.
Support and Resistance Levels
Support
1931.69
Resistance
2118.22
Fibonacci Retracement Levels
0.382
2056.39
0.50
2033.34
0.618
2007.14
0.786
1972.56
0.882
1951.60
Supply Zone
Zone Number
High
Low
First Zone (slightly touched)
2135.11
2096.29
Demand Zone
Zone Number
High
Low
First Zone
2007.63
1929.29
Fair Value Gaps / Imbalances
Gap Number
High
Low
Bullish Gap
2011.19
1981.64
1 Hour Timeframe
Waheed’s Analysis
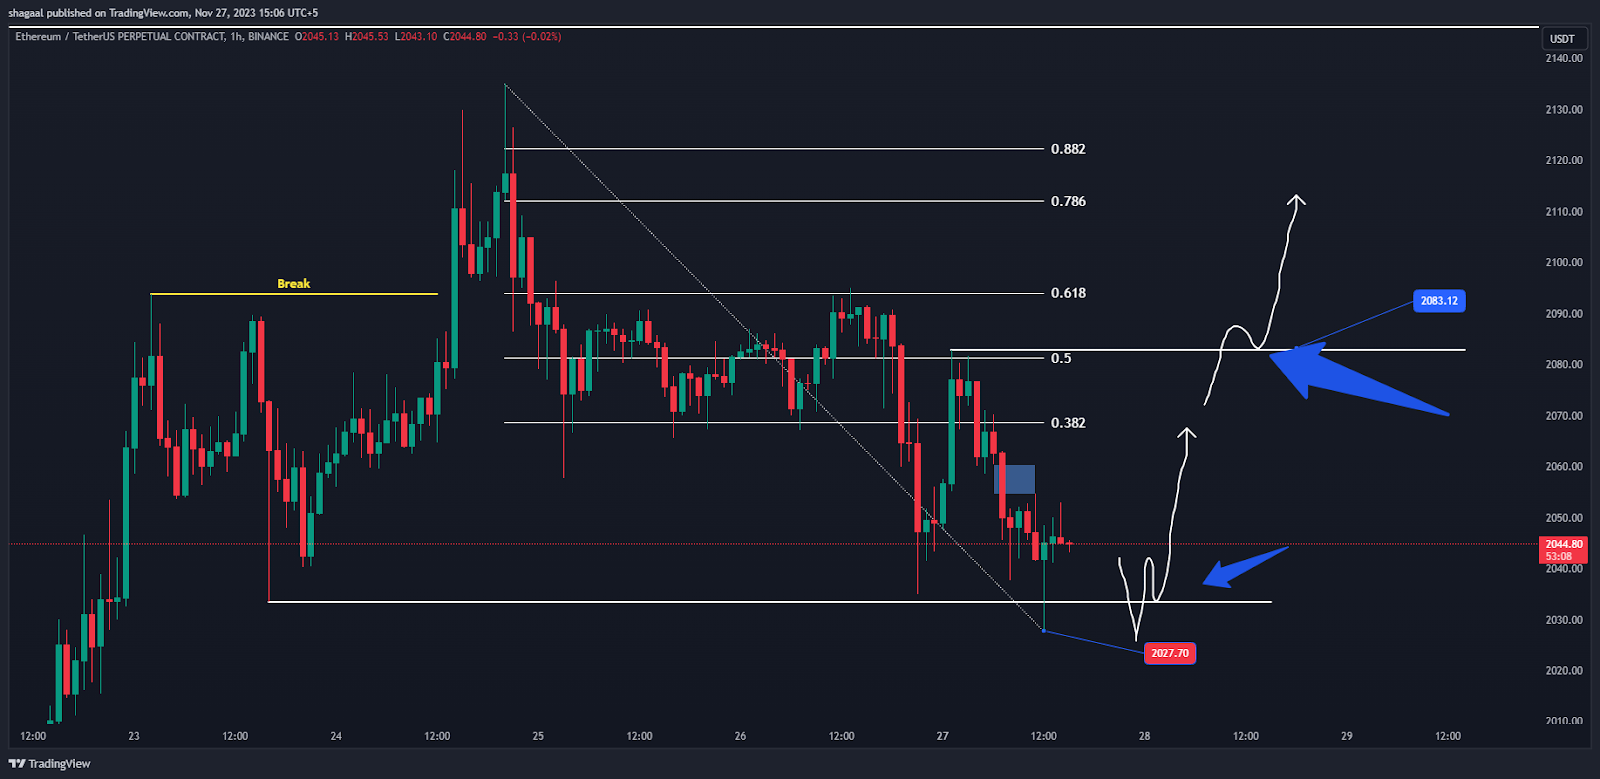
Currently ETH USDT is trading at 2045.11 when writing this blog post. I have taken a long position on Ethereum because it has grabbed the liquidity from the last wick and closed inside the trading range and did not close below the wick, which indicates there is no break of structure yet and the pull back might be over in 1 hour timeframe.
But since there is no proper confirmation on change of structure in the price action, I am waiting for a clean break above 2083 with candle close and then I will add to my position.
The key levels are shown below.
Support and Resistance Levels
Support
2041.60
Resistance
2070.88
Fibonacci Retracement Levels
Bearish Retracement for Short position or Take Profit Zones.